December 22, 2017

Day 22 - Building a secure bastion host, or, 50 ways to kill your server

By: Anna Kennedy (@anna_ken_)
Edited By: Gillian Gunson (@shebang_the_cat)

Bastion (noun) 1. A projecting part of a fortification 2. A special purpose computer on a network specifically designed and configured to withstand attacks

If you deploy servers to a private network, then you also need a way to connect to them. The two most common ways methods are to use a VPN, or to ssh through a bastion host (also known as a jump box). Shielding services this way massively reduces your attack surface, but you need to make sure that the server exposed to the internet is as secure as you can make it.

At Telenor Digital we have about 20 federated AWS accounts, and we wanted to avoid having to set up a complex system of VPNs. Additionally, we wanted to be able to connect to any account from anywhere, and not just from designated IP ranges. Deploying a bastion host to each account would allow us to connect easily to instances via ssh forwarding. Our preferred forwarding solution is sshuttle, a "transparent proxy server / poor man's VPN".

This is where it got... interesting. At the time of writing, Amazon AWS did not have a designated bastion host instance type available. Nor in fact do any of the other main cloud providers, nor did there appear to be any other trustworthy bastions available from other sources. There didn’t even seem to be any information about how other people were solving this problem.

I knew that we wanted a secure bastion such that:

  1. Only authorised users can ssh into the bastion
  2. The bastion is useless for anything BUT ssh'ing through

How hard could making such a bastion possibly be?

Constraints and processes

Our technology stack uses Ubuntu exclusively, and we wanted the bastion to be compatible with the various services we already deploy, such as Consul, Ansible, and Filebeat. Beyond that, I personally have a lot more experience with Ubuntu than I do with any other OS.

For these reasons we decided to base the bastion on a minimal Ubuntu install, strip out as many packages as possible, add some extra security, and make a golden image bastion AMI. Had it not been for these constraints, there might be better OSs to start with, such as Alpine Linux.

Additionally, we run everything in AWS so one or two points of the following are AWS-specific, but based on a lot of conversations it seems that the bastion problem is one that affects a much wider range of architectures.

We use Packer to build our AMIs, Ansible to set them up and Serverspec to test them, so building AMIs is a pretty fast process, typically taking about five minutes. After that we deploy everything using Terraform, so it's a quick turnaround from code commit to running instance.

Starting point: Ubuntu minimal-server

My first port of call: what packages are pre-installed in an Ubuntu minimal-server? Inspection via $apt list --installed or $ dpkg-query -W showed over 2000 packages, and of those I was surprised how many I'd never heard of. And of the ones I had heard of, I was further surprised how many seemed, well, superfluous.

I spent some time and made a few spreadsheets trying to figure out what all the mystery packages were before I got bored and had the bright idea of leveraging Ubuntu's package rating system: all packages are labelled as one of: required, important, standard, optional, or extra.

$ dpkg-query -Wf '${Package;-40}${Priority}\n'
apt                             important
adduser                         required
at                              standard
a11y-profile-manager-indicator  optional
adium-theme-ubuntu              extra

Remove optional and extra packages

Those optional and extra packages sounded very nonessential. I was pretty sure I could rip those out with a nice one-liner and be done.

dpkg-query -Wf '${Package;-40}${Priority}\n' | awk '$2 ~ /optional|extra/ { print $1 }' | xargs -I % sudo apt-get -y purge %

Turns out this was not my best ever idea. All sorts of surprising packages were marked optional or extra and were thus unceremoniously removed, including:

  • cloud-init
  • grub
  • linux-base
  • openssh-server
  • resolvconf
  • ubuntu-server (meta-package)

It doesn't take a genius to realise that removing grub, open-ssh or resolvconf is colossally ill-advised, but even after I tried not removing these but uninstalling the rest I had no luck. On every build I got an unstable and/or unusable image, often not booting at all. Interestingly it broke in a different way each time, possibly something to do with how fast it was uprooting various dependencies before it got to an unbootable state. After quite a lot of experimenting with package-removal lists and getting apparently nondeterministic results, it was time for a new strategy.

Remove a selected list of packages

I revised my plan somewhat in the realisation that maybe blindly removing lots of packages wasn't the best of ideas. Maybe I could look through the package list and remove the ones that seemed the most 'useful' and remove them. Some obvious candidates for removal were the various scripting languages, plus tools like curl and net-tools. I was pretty sure these were just peripherals to a minimal server.

Package nameOk to remove?Dependency
curlnoConsul
edyes
ftpyes
gawkyes
nanoyes
net-toolsnosshuttle
perlnossh
python 2.7noAnsible
python 3noAWS instance checks
rsyncyes
screenyes
tarnoAnsible
tmuxyes
vimyes
wgetyes

It turns out I was incorrect. Due to the various restrictions placed upon the system because we use Consul, sshuttle, Ansible and AWS, about half of my hitlist was unremovable.

To compensate for the limitations in my "remove all the things" strategy, I decided to explore limiting user powers.

Restrict user capabilities

Really, I didn't want users to be able to do anything - they should only be allowed to ssh tunnel or sshuttle through the bastion. Therefore locking down the specific commands a user could issue ought to limit potential damage. To restrict user capabilities, I found four possible methods:

  • Change all user shells to /bin/nologin
  • Use rbash instead of bash
  • Restrict allowed commands in authorized_keys
  • Remove sudo from all users

All seemed like good ideas - but on testing I discovered that the first three options only work for pure ssh tunnelling, and don’t work in conjunction with sshuttle.

Remove sudo

I disabled sudo by removing all users from the sudo group, which worked perfectly apart from introducing a new dimension to bastion troubleshooting - without sudo it’s not possible to read the logs nor perform any meaningful investigation on the instance.

We offset most of the pain by having the bastion export its logs to our ELG (Elasticsearch, Logstash, Graylog) logging stack, and export metrics to Prometheus. Between these, most issues were easily identified without needing direct sudo access directly. For the couple of bigger build issues that I had in the later stages of development, I built two versions of the bastion at a time, with and without sudo. A little clunky, but only temporarily.

With the bastion locked down as much as possible, I then added in a few more restrictions to finalise the hardening.

Install fail2ban

An oldie but a goodie, fail2ban is fantastic at restricting logon attempts by locking out anyone who fails to login three times in a row for a determined time period.

Use 2FA and port knocking

Some clever folks in my team ended up making a version of sshuttle that invokes AWS two-factor authentication for our users, and implements a port knocking capability which only opens the ssh port in response to a certain request. The details of this are outside the scope of this article, but we hope to make this open-source in the near future.

Finally! A bastion!

After a lot of experiments and some heavy testing, the bastion was declared production-ready and deployed to all accounts. The final image is t2.nano sized, but we’ve not seen any problems with performance so far as the ssh forwarding is so lightweight.

It's now been in use for a least half a year, and it's been surprisingly stable. We have a Jenkins job that builds and tests the bastion AMI on any change to the source AMI or on code merge, and we redeploy our bastions every few weeks.

I still lie awake in bed sometimes and try to work out how to build a bastion from the ground up, but to all intents and purposes I think the one we have is just fine.

References

Related content

December 21, 2017

Day 21 - Lighting Up Your Haunted Graveyards

By: Carla Geisser
Edited By: Brendan Murtagh (@bmurts)

The subsystem that shows up as a cause in every postmortem, but never gets fixed. The source file that begins with comments by several generations of engineers warning of the hazard that lies within. These are your organization’s haunted graveyards.

haunted graveyard

A common conversation goes like this -

Enthusiastic New Person: “My manager suggested I add better monitoring to the $scary_thing, where should I start?”

Grumpy Senior Engineer: “Um, the code is over there, but it’s 50,000 lines of spaghetti. The last time we touched it we learned it also processes payroll, and the person who wrote it quit 6 months ago. We just try not to touch it.”

A Different Grumpy Senior Engineer: “Yup, I looked at fixing it a few years ago and gave up. When it crashes we just restart it and hope it keeps going.”

Great. Now you have a system so haunted that two senior members on the team refuse to go near it. You’ve chosen to encase it in concrete and warning signs rather than fix it.

This is a huge trap. If you’re very lucky, you’ll only have to walk into the graveyard for security and platform updates, which are probably going to be ok. More likely the system will break spectacularly when you least expect it, and you’ll write a postmortem containing the phrases “technical debt” and “key components with no owner.”

What do you do now? March in with flashlights and throw a party.

History Class

Find out as much as you can about the system, especially about how it has evolved over time. You want facts, not tales that get told over $beverages after a big outage. Seek out what has been tried before, and why those attempts failed. Understand the circumstances, since things are probably different now.

Information Gathering

Figure out what the $scary_thing does and how it interacts with the world. You want to avoid touching the actual system because it is fragile and scary, but get as much data as you can from the outside.

Application, Client, Data, and Network logs can provide indications about what the system expects as inputs and outputs. If logs aren’t available, putting a proxy layer around the system and log everything there (more about that later).

Turn it off and see who yells. This is not recommended for components suspected to be mission critical, but can be very illuminating. And it is faster than staring at logs all day.

Develop A Risk Assessment

Often you’ll find that the circumstances have changed since the last attempt to make progress. Clients of the system may have better resiliency to brief interruptions. You may have moved 80% of the functionality elsewhere.

Look at the downside too: how much scarier do things get if you don’t try and fix this system? Do your Ops people rage-quit from frustration? Does it endanger your next product launch? Is it preventing other systems from improving?

Change Something Small

You know what the thing does (kinda) and you know what else depends on it (maybe?) so now you can change it. Pick something small: a minor library update, running a code linter, or adding some log lines

Treat the first few changes as incidents before you even start. Write up a plan, gather all the experts in case something goes wrong. Book a conference room (or chat channel) and order take-out.

Write a postmortem, even if everything goes fine.

Rinse, repeat as necessary A key reason systems become haunted is lack of practice which leads to fear of change. If a process is scary you should do it frequently until it isn’t scary anymore.

sunny graveyard

Proxies and Mirrored Requests

If leaping right in seems too risky, you have another option. Replace the $scary_thing with a tiny piece of code that forwards each request to the real thing.

Once this proxy is in place, you can use it for instrumentation or as a tool to deprecate your haunted system.

Here is an example workflow:

  1. Replace the $scary_thing with a tiny piece of code that forwards each request to the real thing and pushes the response back to the client.
  2. Have the proxy log everything it sees (or a sample if there’s a lot of it)
  3. Rewrite functionality into the proxy layer. If you’re paranoid, and you should be, run both the old and new workflows and have the proxy log any differences in results.
  4. Slowly migrate requests from the $scary_thing to the proxy layer which is now actually a rewrite of the functionality of the old thing.
  5. Turn off the $scary_thing. Have a party.

This process can be slow and requires engineering, but it is much safer and more reliable than trying to do a rewrite.

Preventing the Haunting

Ideally your systems should never get into this state. However, here are some tips to help prevent your own $scary_thing.

  1. Rebuild and deploy code often, even if not much has changed
  2. Ensure every component has an owner.
  3. Build robust logging and observability into everything so you can refer to data rather than lore.
  4. Treat technology and platform migrations as real projects, and don’t declare them done until all the old components are gone.

Happy Solstice everyone!

December 20, 2017

Day 20 - Regarding the Responsibility of Systems Administrators

By: Ben Rockwood (@benr) Edited By: Joshua Zimmerman (@TheJewberwocky)

Anyone who has worked for me will tell you I’m a big fan of reflection. At the end of every year I utilize a simple Compact Calendar created by David Seah to look back at the year and sketch out, week by week, what happened. By looking back, we can chart the direction that we’ve been traveling, with or, more often, without our conscious knowledge. In DevOps we often say that it’s all about “velocity” and “velocity is speed with direction”, thus our reflections allow us an opportunity to course correct when we determine that the direction we’ve been traveling on doesn’t actually align with our desired course.

SysAdvent is, to me, like a SysAdmin year book. We can see the topics that were important to us during a given time, allowing for reflections in the years to come. There is, therefore, a certain responsibility upon us as we contribute.

Many great things have happened this year in tech for us to reflect on. I strongly feel that that 2017 was the year in which containers finally proved that they are indeed here to stay. The technology itself was never really in question, but a massive ecosystem needed to come around the fundamental technology to make it truly feasible. Kubernetes, Service Meshes powered by intelligent and lightweight reverse proxies like Envoy, Serverless, application centric monitoring and metrics empowered by Prometheus, major changes in SD-WAN and NFV that will power Hybrid Cloud and reliance on telecom networks in a way never before seen, and on and on, so many technologies that have matured this year and begun to shape a new era in the way we operate services. And while all these things are important, there is a topic far more important, and indeed less enjoyable, which must be addressed as we reflect.

The biggest event of the year in tech was arguably the massive Equifax breach. Equifax made a lot of mistakes in a variety of ways, but if you are reading this you likely know how the IT and Operations functions are managed and run inside most companies. I doubt it would take much effort for you to examine the few facts we have about what happened at Equifax to build your own mental picture of what it was like before and during the breach. Tell me honestly, could this have been prevented? We all know that it could have been. Tell me honestly, is your organization any better? I’m willing to bet you are not. Yes, Equifax Inc. took the blame and certainly there is a very real systemic problem there. But while the ultimate responsibility lies in the leadership of the company, the problem occurred because the SysAdmins, our brothers and sisters, failed to prevent it.

If we’re not stopping to reflect on our part in these massive breaches then we’re frankly unqualified to do this type of work. When you hear of these breaches do you get a chill down your spine with fear that you too are vulnerable? That you could be next? And what do you do in response? My guess is very little. There may be a short, focused attention to security but after we’ve worked off enough of our guilt we tend back towards business as usual.

In 2011 when I delivered my LISA Keynote “The DevOps Transformation”, I tried to make a case for a new level of professionalism within Systems Administration by, among other things, casting DevOps as not any one specific thing but rather a “banner for change”, dispelling a general fear of standards and best practices, such as ITIL and COBIT, and connecting Systems Administration with the greater tradition of Operations Management over the previous 100 years. I have also predicted elsewhere that tech will become a regulated industry by 2030. We are seeing events nearly every month which make me more and more convinced of these positions. The level of professionalism and accountability in our trade must rise significantly. With no credible industry governing bodies to drive this transformation, it must happen culturally. DevOps was that cultural change, but the sheer magnitude of changes we have needed to take place has largely trumped this meta-theme.

I firmly believe that that every operations team, of any size, should be externally auditing for SOC2 Type II compliance with, at a minimum, the Security Principle. Furthermore, the European Unions General Data Protection Regulation (GDPR), while it may have its faults, is a quantum leap forward for both the rights of individuals and accountability of corporations. We can no longer afford to remain cynical geeks belittling such reasonable advances as a PITA. If your unsure of where to start, consider the Cloud Security Alliances STAR Self Assessment.

Above all, Systems Administrators must step up and take a more active role in systems engineering and architecture. SysAdmin’s don’t create business software, we assemble software together to provide value. That is, SysAdmin’s engineer and architect solutions as integrators; creating, maintaining, and protecting business value. All too often we feel lucky just to keep up on last years trends and handle the day to day incidents and maintenance tasks.

The solution isn’t to hit the brakes on innovation, lock everything down and focus just on security and privacy. Rather, we have a variety of innovations that give administrators increasing levels of sophistication and capability. Docker and Kubernetes allow for very small surface areas and a more testable and deployable solution set than we’ve ever had before. Hashicorp’s Vault and Consul allow for security capabilities that were only a dream just a couple of years ago.

One concept that particularly excites me is Kubernetes Operators which “represents human operational knowledge in software to reliably manage an application.” While this isn’t a terribly new concept, its never looked so achievable as it does with Kubernetes. A It drives towards the old famous SysAdmin mantra of “automate yourself out of a job.” Clearly, that never happens, but extending Operators with an increasing body of knowledge rather than creating text documents and procedures clearly the way of the future, particularly when Kubernetes give us a rich API and consistent deployment model.

And so, as we come to the end of 2017, I’d strongly encourage you to grab a Compact Calendar and reflect on your year to examine your velocity. How fast did you really go? What direction did you really go? And, above all, did you make the most important things the most important things? As we close out the decade lets use all these amazing new innovations serve the goal of providing real value to real people. We are in the best possible positions to advocate on their behalf and create real change to safeguard the rights to privacy and security that all people should enjoy.

December 19, 2017

Day 19 - Infrastructure Testing: Sanity Checking VPC Routes

By: Dan Stark (@danstarkdevops)
Edited By: James Wen

Testing Infrastructure is hard; testing VPCs is even harder

Infrastructure testing is hard. My entire career I’ve tried to bring traditional development testing practices into operations. Linters. Rspec. Mock objects. These tools provide semantic and syntax checking, as well as unit and integration level coverage for infrastructure as code. Ideally, we would also test the system after the code is deployed. End-to-end infrastructure testing has always been a stretch goal – too time-consuming to implement from scratch. This is especially true of network level testing. I am not aware of any existing tools that provide self-contained, end-to-end tests to ensure VPCs, subnets, and route tables are properly configured. As a result, production network deployments can be incredibly anxiety-inducing. Recently, my coworkers and I set up an entire VPC (virtual private cloud) using infrastructure as code, but felt we needed a tool that could perform a VPC specification validation to catch bugs or typos before deployment. The goal was to sanity check our VPC routes using a real resource in every subnet.

Why is this necessary

A typical VPC architecture may contain multiple VPCs and include peering, internal/external subnets, NAT instances/gateways, and internet gateways. In the “Reliability Pillar” of their “Well-Architected Framework” whitepaper, AWS recommends designing your system based on your availability need. At Element 84, we desired 99.9% reliability for EC2, which required 3 external and internal subnets having CIDR blocks of /20 or smaller. In addition, we needed 9 of these redundant VPCs to provide required network segregation. It took significant effort to carve out VPCs with dependent rules and resources for three availability zones.

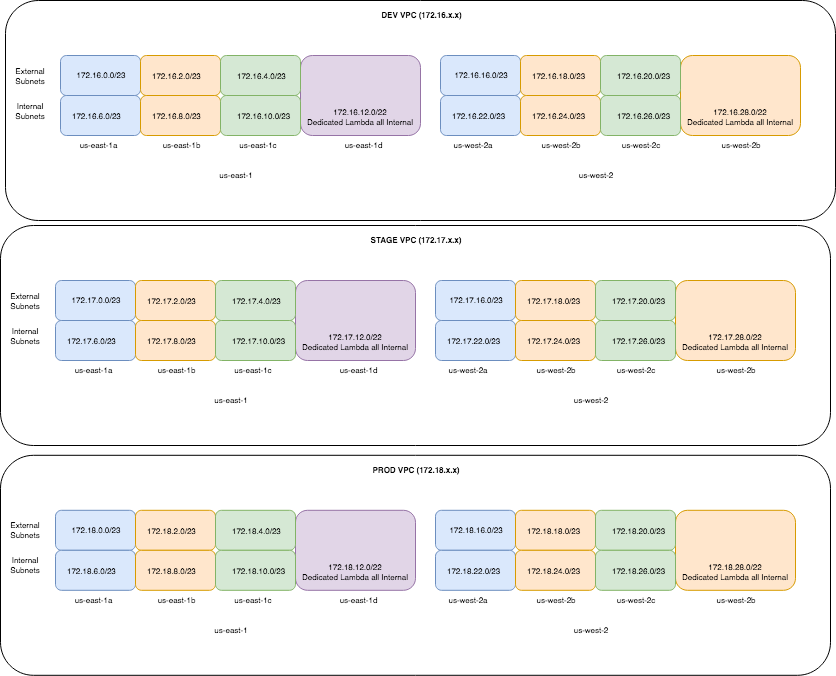
Here is a hypothetical example of multiple VPCs (Dev, Stage, Prod) over two regions:

image1

Extending this example with additional VPCs for bastion hosts, reporting, and Demilitarized Zones for contractors (DMZs), both NonProd and Prod:

image 2

It’s too easy for a human to make a mistake, even with infrastructure as code.

Managing VPC infrastructure

Here’s one example of how we want a VPC to behave:

We want a Utility VPC peered to a Staging VPC. The Utility VPC contains bastion EC2 instances living in external subnets and the Staging VPC contains internally subnetted application EC2 instances. We want to test and ensure the connectivity between these resources. Also, we want to verify that every bastion EC2 can communicate with all the potential application EC2 instances, across all subnets. Additionally, we want to test connectivity to the external internet for the application EC2 instances, in this case via a NAT gateway.

These behaviors are well defined and should be tested. We decided to write a tool to help manage testing our VPCs and ensuring these kinds of behaviors. It contains:

  1. a maintainable top level DSL written in YAML to declare the VPC specification that sits above the VPC configuration code; and
  2. a mechanism to be able to test the network level connectivity between VPCs, subnets, IGW/NAT and report any problems.

Introducing: VpcSpecValidator

This project is “VpcSpecValidator,” a Python 3 library built on top of the boto3.

There are a few requirements in how you deploy your VPCs to use this library:

  1. You must have deployed your VPCs with CloudFormation and have Outputs for internal subnet with the strings “Private” or “Public” and “Subnet”, e.g. “DevPrivateSubnetAZ1A”, “DevPrivateSubnetAZ1B”, “DevPrivateSubnetAZ1C.”
  2. All VPCs should be tagged with ‘Name’ tags in your region(s).
  3. You must ensure your that a security group attached to these instances allows SSH access between your VPC peers. This is not recommended for production so you may want to remove these rules after testing.
  4. You must have permissions to create/destroy EC2 instances for complete setup and teardown. The destroy method has multiple guards to prevent you from accidentally deleting EC2 instances not created by this project.

You supply a YAML configuration file to outline your VPCs’ structure. Using our example above, this would look like:

project_name: mycompany
region: us-east-1
availability_zones:
  - us-east-1a
  - us-east-1b
  - us-east-1c

# Environment specification
dev:
  peers:
    - nonprod-util
    - nonprod-reporting
  us-east-1a:
    public: 172.16.0.0/23
    private: 172.16.6.0/23
  us-east-1b:
    public: 172.16.2.0/23
    private: 172.16.8.0/23
  us-east-1c:
    public: 172.16.4.0/23
    private: 172.16.10.0/23

stage:
  peers:
    - nonprod-util
    - nonprod-reporting
  us-east-1a:
    public: 172.17.0.0/23
    private: 172.17.6.0/23
  us-east-1b:
    public: 172.17.2.0/23
    private: 172.17.8.0/23
  us-east-1c:
    public: 172.17.4.0/23
    private: 172.17.10.0/23

nonprod-util:
  peers:
    - dev
    - stage
  us-east-1a:
    public: 172.19.0.0/23
    private: 172.19.6.0/23
  us-east-1b:
    public: 172.19.2.0/23
    private: 172.19.8.0/23
  us-east-1c:
    public: 172.19.4.0/23
    private: 172.19.10.0/23

nonprod-reporting:
  peers:
    - dev
    - stage
  us-east-1a:
    public: 172.20.0.0/23
    private: 172.20.6.0/23
  us-east-1b:
    public: 172.20.2.0/23
    private: 172.20.8.0/23
  us-east-1c:
    public: 172.20.4.0/23
    private: 172.20.10.0/23

prod:
  peers:
    - prod-util
  us-east-1a:
    public: 172.18.0.0/23
    private: 172.18.6.0/23
  us-east-1b:
    public: 172.18.2.0/23
    private: 172.18.8.0/23
  us-east-1c:
    public: 172.18.4.0/23
    private: 172.18.10.0/23

prod-util:
  peers:
    - prod
  us-east-1a:
    public: 172.19.208.0/23
    private: 172.19.214.0/23
  us-east-1b:
    public: 172.19.210.0/23
    private: 172.19.216.0/23
  us-east-1c:
    public: 172.19.212.0/23
    private: 172.19.218.0/23

prod-reporting:
  peers:
    - prod
  us-east-1a:
    public: 172.20.208.0/23
    private: 172.20.214.0/23
  us-east-1b:
    public: 172.20.210.0/23
    private: 172.20.216.0/23
  us-east-1c:
    public: 172.20.212.0/23
    private: 172.20.218.0/23

The code will:

  1. parse the YAML for a user-specified VPC,
  2. get the public or private subnets associated with each Availability Zone’s CIDR range in that VPC,
  3. launch an instance in those subnets,
  4. identify the peering VPC(s),
  5. create a list of the test instances in the peer’s subnets (public or private, depending on what was specified in step 2),
  6. attempt an TCP socket connection using the private IP and port 22 for each instance in this list.

Step 5 posed an interesting deployment challenge. We decided UserData was a good option to bootstrap and clone the repo on an EC2 instance, but did not know how to pass it peered VPC’s private IP addresses as SSH targets.

Given the entire specification is in one file and the CIDR ranges are available, we can cheat and look at the Outputs of the peer(s)’ CloudFormation stack and see if any instances created in Step 3 match.

def get_ip_of_peer_instances_and_write_to_settings_file(self):

    '''
    This is run on the source EC2 instance as part of UserData bootstrapping
    1) Look at the peer(s)' VPC CloudFormation Stack's Outputs for a list of subnets, public or private as defined in the constructor.
    2) Find instances in those subnets created by this library
    3) Get the Private IP address of target instances and write it to a local configuration file
    '''
        
    # Query for peer CloudFormation, get instances
    target_subnet_list = []
    target_ip_list = []
    with open(self.config_file_path, 'r') as ymlfile:
        cfg = yaml.load(ymlfile)
    
    for peer in self.peers_list:
        peer_stack_name = "{}-vpc-{}-{}".format(self.project_name, peer, cfg['region'])
    
        # Look at each peer's CloudFormation Stack Outputs and get a list of subnets (public or private)
        client = boto3.client('cloudformation')
        response = client.describe_stacks(StackName=peer_stack_name)
        response_outputs = response['Stacks'][0]['Outputs']
    
        for i in range(0,len(response_outputs)):
            if self.subnet_type == 'public':
                if 'Subnet' in response_outputs[i]['OutputKey'] and 'Public' in \
                        response_outputs[i]['OutputKey']:
                    subnet_id = response_outputs[i]['OutputValue']
                    target_subnet_list.append(subnet_id)
    
            else:
                if 'Subnet' in response_outputs[i]['OutputKey'] and 'Private' in \
                        response_outputs[i]['OutputKey']:
                    subnet_id = response_outputs[i]['OutputValue']
                    target_subnet_list.append(subnet_id)
    
    
        # Search the instances in the targeted subnets for a Name tag of VpcSpecValidator
        client = boto3.client('ec2')
        describe_response = client.describe_instances(
            Filters=[{
                'Name': 'tag:Name',
                'Values': ['VpcSpecValidator-test-runner-{}-*'.format(peer)]
            }]
        )
    
        # Get Private IP addresses of these instances and write them to target_ip_list.settings
    
        for i in range(0,len(describe_response['Reservations'])):
            target_ip_list.append(describe_response['Reservations'][i]['Instances'][0]['PrivateIpAddress'])
    
        # Write the list to a configuration file used at runtime for EC2 instance
        with open('config/env_settings/target_ip_list.settings', 'w') as settings_file:
            settings_file.write(str(target_ip_list))

There is also a friendly method to ensure that the YAML specification matches what is actually deployed via CloudFormation templates.

spec = VpcSpecValidator('dev', subnet_type='private')

spec.does_spec_match_cloudformation()

Next Steps

At Element 84, we believe our work benefits our world, and open source is one way to personify this value. We’re in the process of open sourcing this library at the moment. Please check back soon and we’ll update this blog post with a link. We will also post a link to the repo on our company Twitter.

Future features we would like to add:

  • Make the VpcSpecValidator integration/usage requirements less strict.
  • Add methods to test internet connectivity.
  • Dynamic EC2 keypair generation/destruction. The key pairs should be unique and throwaway after the test.
  • Compatibility with Terraform.
  • CI as a first-class citizen by aggregating results in JUnit-compatible format. Although I think it would be overkill to run these tests with every application code commit, it may make sense for infrastructure commits or running on a schedule.

Wrap Up - Testing VPCs is difficult but important

Many businesses use one big, poorly defined (default) VPC. There are a few problems with this:

Development resources can impact production

At a fundamental level, you want to have as many barriers between development and production environments as possible. This isn’t necessarily to stop developers from caring about production. As an operator, I want to prevent my developers from being in a position where they might unintentionally impact production. In addition to security group restrictions, avoid these potential mishaps impossible from a network perspective. To steal an idea from Google Cloud Platform, we want to establish "layers of security.” This tool helps to enforce these paradigms by validating VPC behavior prior to deployment.

Well-defined and well-tested architecture is necessary for scaling

This exercise forced our team to think about our architecture and its future. What are the dependencies as they sit today? How would we scale to multi-region? What about third party access? We would want them in a DMZ yet still able to get the information they need. How big do we expect these VPCs to scale?

It’s critical to catch these issues before anything is deployed

The best time to find typos, configuration, and logic errors is before the networking is in use. Once deployed, these are hard errors to troubleshoot because of the built-in redundancy. The goal is to prevent autoscaling events yielding a “how was this ever working” alarm at 3AM because one subnet route table is misconfigured. That’s why we feel a tool like this has a place in the community. Feel free to add comments and voice a +1 in support.

Happy SysAdvent!

December 18, 2017

Day 18 - Awesome command-line fuzzy finding with fzf

By: Nick Stielau (@nstielau)

Edited By: Sascha Bates (@sascha_d)

It’s all about the CLIUX

Ok, CLIUX is not a word, but command-line interface user experience is definitely a worthy consideration, especially if you use the command line on a daily basis (or, hourly). Web apps and graphical user interfaces usually get the design love, but this holiday season, treat yourself to a great command line user experience.

Now that we’re thinking about CLIUX, we can roll up our sleeves and see how we can improve some of our everyday command line operations. This can be as simple as adding in some colors to our shell prompts or big as changing over to a new shell.

We’re going to focus on a few ways to make finding things easier.

Enter FZF

A lot of CLI is about finding stuff. Sometimes that is finding the right files to edit, or searching through git logs to review, or finding a a process Id or user Id to use as a parameters for other commands (kill, chgrp, etc).

Fzf is a fuzzy finder, a CLI tool that is explicitly meant to bridge the technical need to find things with the user need to find them easily. It has been around for a few years, but this is the year you use it to make your CLIUX awesome.

FZF Logo

FZF adheres to the Unix Philosophy of doing one thing, and doing it well and valuing composability. These two characteristics make it likely we can find lots of ways to use fuzzy finding, and to integrate it into our daily operations.

Quick shoutout to junegunn for authoring fzf and Tschuy for introducing fzf to me.

Using FZF

Getting started

You can install FZF with package managers, brew install fzf for OSX and dnf install fzf for Fedora, or check out the full installation instructions for other options. Once you’ve got it installed, we’ll start fuzzy finding!

Step 1) Piping data into FZF

We’ll start off looking at how we can pipe an input set to fzf and doing some fuzzy finding. Fzf can fuzzy search any input from stdin. For starters, let’s pipe our dictionary through fzf,

cat /usr/share/dict/words | fzf

and start typing to narrow down the list to matching words: c l n j f i. Ok, so there is one word out of the 235,886 in the dictionary that contains those letters in that order. Clanjamfrie.

Searching for clanjamfrie

It’s a Scottish word that means spoken nonsense, as in"Anyone who doesn’t like fuzzy finding is just spouting clanfamfrie.“ Who knew?

Step 2) Piping data out of FZF

Now we are getting somewhere. Selecting a dictionary word is pretty useful, but how can we make this really great? That’s right, piping our selected word to cowsay.

cat /usr/share/dict/words | fzf | cowsay
fzf and cowsay FTW

Step 3) Live preview

Sysadmins everywhere are on the edge of their seats. Cowsay, dictionaries, fuzzy finding. It’s almost too much. How can we take this to the next level?

Using the --preview flag, we can specify a program for a live preview of our fzf selection. In this case, we can get a preview of exactly how the cow will say it:

cat /usr/share/dict/words | fzf --preview "cowsay {}" | cowsay
Preview that moo

Step 4) Gitting More Pragmatic

Not that cowsay isn’t a real world use-case, but let’s get into something more pragmatic, like… git! This gem of an example is from the ample examples on the fzf wiki (although paired down a bit for consumability here). It shows how to search though git logs and examine a diff. ”`

fshow - git commit browser

fshow() { git log –graph –color=always \ –format=“%C(auto)%h%d %s %C(black)%C(bold)%cr” “$@” | fzf –ansi –bind “enter:execute: (grep -o ‘[a-f0-9]{7}’ | head -1 | xargs -I % sh -c ‘git show –color=always % | less -R’) << ‘FZF-EOF’ {} FZF-EOF” } “`

The big new addition here is the --bind option, which can specify a program to execute upon key press or selection. The fshow function uses this functionality to view the git diff with less when enter is pressed.

Here’s the fshow function running against the fzf codebase:

Finding a git commit

Step 5) Make viewing diffs easy

This is pretty cool, but we already know how to make it cooler. With --preview!

fshow() {
  git log --graph --color=always \
      --format="%C(auto)%h%d %s %C(black)%C(bold)%cr" "$@" |
  fzf --ansi --preview "echo {} | grep -o '[a-f0-9]\{7\}' | head -1 | xargs -I % sh -c 'git show --color=always %'" \
             --bind "enter:execute:
                (grep -o '[a-f0-9]\{7\}' | head -1 |
                xargs -I % sh -c 'git show --color=always % | less -R') << 'FZF-EOF'
                {}
FZF-EOF"
}
Previewing diffs

Wow! Does anyone else feel like we just implemented Github in like 6 lines?!?!

Step 6) Man Explorer

Or, whip up a man page explorer with search and live-preview. Once you have the format down, you can imagine more use-cases that boil down to fuzzy finding with a detailed preview that you can select to execute additional commands, optionally falling back to the beginning.

# This is ugly.  Refactoring left as exercise to reader...
function  mans(){
man -k . | fzf -n1,2 --preview "echo {} | cut -d' ' -f1 | sed 's# (#.#' | sed 's#)##' | xargs -I% man %" --bind "enter:execute: (echo {} | cut -d' ' -f1 | sed 's# (#.#' | sed 's#)##' | xargs -I% man % | less -R)"
}
Man Page Explorer

Why I can’t live without FZF

Ok, I guess I could live. But my command line useage would be a little sadder. For example, I use these kubernetes config helpers every day. In addition to saving some time, I get a little bit more joy out of the fzf implementations. I love the command line, but that doesn’t mean I don’t want a great user experience. Heck, I deserve one.

# short alias for picking a Kube config
# Find cluster definitions in ~/.kube and save one as variable.
c () {
  export KUBECONFIG=$(find ~/.kube -type f -name '*'"$1"'*' -exec grep -q "clusters:" {} \; -print | fzf --select-1)
}

# helper for setting a namespace
# List namespaces, preview the pods within, and save as variable
ns () {
    namespaces=$(kubectl get ns -o=custom-columns=:.metadata.name)
    export NS=`echo $namespaces | fzf --select-1 --preview "kubectl --namespace {} get pods"`
    echo "Set namespace to $NS"
}

# short alias that uses chosen namespace
k () {
    kubectl --namespace=${NS:-default} $@
}

Choosing a namespace:

Kubernetes Namespace Chooser

Conclusion

If you want to spruce up your command line user experience, dig in with fzf and put the power of fuzzy finding to use. Junegunn’s fzf is a simple, composable tool that can make your command line more efficient and usable for 2018.

References, Details and Inspiration

December 17, 2017

Day 17 - Don’t Fall for the Hybrid Cloud Trap

By: Andrew Shieh (@shandrew)
Edited By: Alfonso Cabrera (@alfonso__c)

Your December may be full of thoughts and planning around the future of your computing infrastructure. If so, try to take a vacation! Still thinking about your infrastructure? If you’re still operating your own hardware, you’ll need to evaluate how the cloud fits into your technology strategy. Understanding your choices requires a quick look at the recent history of the systems readily available.

A Short and Incomplete History of Cloud Computing

1995: This web thing is cool, and I can pay a web host to handle my Under-Construction.gif! But I need more on the backend, and don’t want to share resources with 254 other users. I’m going to keep running my own.

2000: I survived Y2K! This VMware product looks neat, but what in the world would I do with it? Running multiple “servers” on my servers seems like more work for me.

2006: So Amazon, the book retailer, is trying to sell me storage, by the byte? Seems odd, but I like the idea better than my current storage strategy of buying new NFS servers every time we’re nearing capacity. It typically endswith a mess of different server types and disk configurations.

2007: Hm, Amazon’s offering virtual servers too. They seem pretty weak compared to what we are running ourselves, and are a bit pricey, and unreliable. Maybe we can try them out for some temporary usage, or try using them for peak loads, but our data center’s servers are faster, cheaper and more reliable. We know how to run them.

2010: That AWS ball has really been rolling! They’ve lowered their prices, added load balancing, autoscaling, and private networking. It’s beginning to look more like my nice, stable data center. We could try them out, Netflix seems to like it, but we’re quite happy with our blazingly fast SSDs, and AWS has nothing like that.

2012: Google and Microsoft are getting into this game too? Maybe we should take this more seriously. And OpenStack makes it look like I can run the same kind of things on my servers. Wait, AWS has SSDs now? I just spent a month rotating SSDs out of all of our RAIDs to fix their #%! firmware bugs. Hmmm.

2014 : Virtual GPUs, 100 more things

2016 : 10x of 2014

The pace of development of cloud computing, especially in AWS, resembles that of a paperclip manufacturing AI. The concept of having your computing infrastructure completely hosted by a third party has gone from controversial to “boring technology”. Even the virtualization technology that we rarely surface has improved at an astonishing rate. All of these advancements feed back into the development machine, making the technologies cheaper and better.

Did I Miss the Boat?

You saw allthis cool stuff go by, but you’re still running your own data center. It’s worked for you, and you don’t have the staff and the time to migrate to something else. But your management is pushing you to have better peak load capacity, lower costs, and greater agility. You finally decide to reply to one of the hundreds of emails you have in your Vendor inbox, on Hybrid Clouds for Easy Cloud Migration. They promise you that you can keep running in your data center while you move to the cloud at your own pace. Maybe you can even keep the same infrastructure running in both.

In some short time window in our cloud past, this may have made sense. Using the cloud for peak loads made sense; using the cloud for things where the servers were disposable made sense. But while you were busy running your own metal, the cloud grew cheaper and the uptimes got way better than yours. The benefits of moving everything to the cloud grew, far past the break even point. Every day you’re not there is a larger opportunity lost.

A consultant/vendor-supported hybrid cloud solution doesn’t get you on the boat fast enough. They’re looking for your dollars every month in perpetuity, while your goal should be around migrating to 100% cloud. Supporting two technologies and infrastructures adds complexity to your architecture. It also adds cost and stretches your staff thin. The trap happens when supporting the hybrid model sucks your resources to the point where you cannot complete your migration to the cloud–the last bits are the hardest.

To avoid this trap, you’ll need to carefully plan your management of your datacenter and cloud systems. Developing their configurations in parallel rather than trying to plaster an awkward unifying layer on top will pay off in the long run. Follow best practice recommendations of your cloud provider. Join the communities of people using the same provider; your systems are inevitably much more similar, and working together is even more valuable.

Make 100%-cloud your priority, and have a quiet, pager-free SysAdvent.

December 16, 2017

Day 16 - Inspec gives insight

By: Jamie Andrews (@vorsprungbike)

Edited By: Ben Cotton (@FunnelFiasco)

What is Inspec?

How often to do want to scan your servers, all of them, to check a library has the correct version or that the right disk clone is mounted?

Configuration control systems like Puppet, Chef and Ansible have become de rigueur in running even modest sized groups of servers. Configuration control offers centralised control over a state which is set by policy.

However, sometimes something happens to one or more servers which challenges this happy state of affairs.

There might be a change requirement that doesn't fit in with the way that the configuration system works. You might decide that part of the system should be managed in a different way. Someone in your team might "temporarily" disable the configuration agent and then not turn it back on again - configuration drift happens

When it does happen, inevitably there are hard to trace and puzzling to understand problems.

This might be a job for a quick shell script and some ssh magic. But often I've done this and then realised that it's difficult to get just right. Inspec is a framework for systematically carrying out these types of tests.

Inspec can be very useful in these circumstances. It works like a configuration management tool like Puppet or Chef in that it holds a model of what the correct configuration should be. However, it does not modify the configuration. Instead it tests the targeted systems for compliance to the correct configuration.

I have found this to be useful in the situation where there are many systems, just a few of which have a problem. Inspec can pinpoint the problem systems, given a configuration profile.

And of course Inspec can be used to proactively check servers to detect problems before they occur

Inspec is based on an earlier system called "serverspec" and it uses the ruby classes from the rspec package.

Although it is promoted by Chef as part of their wider product offering, it works just fine standalone and is fully open source

What I'm covering in the article

Below, I'll look at installing Inspec, making a simple project "profile", how it works in action and installing a third party security checking profile

Setting up and installing

The easiest way of installing it is to use a package. Packages for Redhat and varients, Ubuntu, Suse, MacOSX and MS Windows are available here https://downloads.chef.io/inspec

Inspec has a dependency on Ruby. The packages include a bundled version of Ruby that avoids compatiblity problems. If you already have ruby installed and want to use it then "gem install inspec" is available. See the github repo https://github.com/chef/inspec for more details

To check Inspec is installed try this command

inspec version

Which will come back with the current installed version

Inspec does not have to be installed on all the target nodes. I have it installed on one admin host with ssh access to everything else. This allows any profile rule sets to be tested on anything it can ssh to. No agents, install of ruby or anything else is required

Make your own profile

inspec works by using a profile directory with a a set of control files that contain tests The "init profile" cli command is used to make a new profile

To see a generic blank profile do

inspec init profile example

The output from this command is something like

$ inspec init profile example
WARN: Unresolved specs during Gem::Specification.reset:
      rake (>= 0)
WARN: Clearing out unresolved specs.
Please report a bug if this causes problems.
Create new profile at /home/jan/temp/example
 * Create directory libraries
 * Create file inspec.yml
 * Create directory controls
 * Create file controls/example.rb
 * Create file README.md

It has made a set of files. The most interesting is "example/controls/example.rb"

This is very simple test that checks if /tmp exists, take a look at it

# encoding: utf-8
# copyright: 2017, The Authors

title 'sample section'

# you can also use plain tests
describe file('/tmp') do
  it { should be_directory }
end

# you add controls here
control 'tmp-1.0' do                  # A unique ID for this control
  impact 0.7                          # The criticality, if this control fails.
  title 'Create /tmp directory'       # A human-readable title
  desc 'An optional description...'
  describe file('/tmp') do            # The actual test
    it { should be_directory }
  end
end

The tests can be declared as "plain tests" or "controls". Being a control adds some metadata which makes it easier to track the test within a set_con

The actual test assertions "it { should be_directory }" follow the rspec syntax. The tests operate on a resource type, in this case "file". There are many useful built in test resourse types, including

  • apache_conf
  • crontab
  • docker
  • etc_fstab
  • http

And a lot more, see https://www.inspec.io/docs/reference/resources/

A more complex example

Here's a real test I wrote a couple of weeks ago to deal with a DNS configuration drift.

The old DNS servers had been retired but we noticed that some servers still mentioned servers on the old network.

# encoding: utf-8

title 'DNS'

# some crude way to build a list of network interfaces
eth_files= ['/etc/sysconfig/network-scripts/ifcfg-eth0']
eth_files << '/etc/sysconfig/network-scripts/ifcfg-eth1' if file('/etc/sysconfig/network-scri
pts/ifcfg-eth1').exist?
eth_files << '/etc/sysconfig/network-scripts/ifcfs-ens32' if file('/etc/sysconfig/network-scr
ipts/ifcfg-ens32').exist?

control 'resolv' do                        # 
  impact 0.7                               # 
  title 'check old dns is not present'     # 
  desc 'old dns'
  describe file('/etc/resolv.conf') do     # The actual test
    its ('content')  { should_not match /193/ }
  end

  eth_files.each do|ef| 
  describe file(ef) do
    its ('content') { should_not match /^DOMAIN=193/ }
    its ('content') { should_not match /^DNS[123]=193/ }
  end
  end

end

I won't explain exactly how it works, you can see that there are regexps in there and that a ruby "each do" construct is used.

To run the tests do

inspec exec tc-config myuser@myhostname

screen shot of it running

As mentioned above, Inspec does not correct these problems. It is great at one job: checking compliance. Once the problem is found then you will have to devise a good method for fixing it.

I when looking at large numbers of live servers I usually run it in a shell and then redirect the output to a file. Once the time consuming checking is done I look at the file The colourizing makes it easy to spot the non-compliant areas

In the above example, I found 12 servers non-compliant out of 146. Some problems were found where Puppet conflicted with Redhat system policy I devised a simple, non-idempotent bash script and applied it to the affected servers only. This was quicker and a more certain result than running it on all the servers. After the correction, I reran the Inspec profile to see that everything was ok

Check to check the check

Once you start trying to use your own tests there is always scope for typos or syntax error or other sorts of mayhem. Inspec tries to help with a static checker.

inspec check example

Comes back with a report of how many controls there are plus if everything is valid.

This feature is a great idea, especially for those of us that are only using this tool occassionally.

Ready to use sets of tests

As the Inspec system is supported and promoted by Chef there are a set of profiles ready made that perform various types of compliance. These can be downloaded and used, see https://supermarket.chef.io/tools?type=compliance_profile

Installing and using the CIS DIL

One really useful profile is the CIS Distribution Independent Linux Benchmark https://github.com/dev-sec/cis-dil-benchmark

To try it, clone that github repo and then

 inspec check cis-dil-benchmark

It has 88 controls, many of which check multiple resources. On our LAN running it against a host took over 3 minutes.

The report it generates is interesting reading.

We will be using this profile for testing images generated with Packer and Puppet. The issues it reports will act as feedback for security improvements to our configuration scripts in Puppet and Packer

Further features

I am just scratching the surface with the many features that Inspec offers.
Please do look at http://inspec.io for a fuller run down!

Thanks

Thanks to Chef for supporting this excellent software and keeping it open source

Thanks to my employers, Institute of Physics Publishing for enabling me to try out cool stuff like this as part of my job.