
This article was written by Sam Cogan (@samcogan)
You've got a performance problem: your Windows server or application isn't performing as well as it should. You need to find out why. When Task Manager isn't enough it's quite likely you'll reach for Perfmon.
If you don't know already, Perfmon is the Windows performance monitor.
It can be found under administrative tools on all versions of Windows from
Windows 2000 onwards. It provides a way to monitor counters - metrics of your
system performance, such as %CPU use, Free Memory etc. Many Windows
applications come with their own custom set of counters for their specific
application. We can use perfmon to setup sets of counters (Data Collector Sets)
to collect data and to allow easy re-use. Once we have created a collector
set we can start logging. We can leave it running however long we like, then
come back and review the data. Perfmon also provides some step by step wizards
to help the beginner start using it quickly.
For more information on using Perfmon, see this article
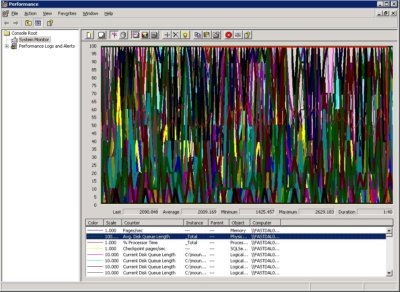
Perfmon is an excellent tool for collecting data. The problem comes when trying to analyse this data. Often, when we're not sure what the problem is, we'll add a wide range of counters to make sure we've covered all areas. Very quickly we've collected a large amount of data about the performance of the problem machine or machines.
Chances are that if you open up these files in Perfmon, then you'll end up with a selection of lines on a graph, information that seems like it should be useful, but is often hard to decipher what it actually means and if you have a lot of counters you can end up with a mess of colour lines that make a nice picture, but has no meaning whatsoever!
What do we do? How do we get some useful information that will help us solve this tricky performance problem?
Yes, you could go through and filter out the lines you don't need. What you really need is a way to give meaning to these lines - to see what is normal or abnormal, or to simplify the data or change its presentation into something more digestable. This is where PAL comes in.
PAL
Perfromance Analyis of Logs or PAL is a tool written by Clint Huffman at Microsoft, to assist in analysing Perfmon logs and to produce an HTML report that will provide detailed graphs, and indications of where a problem may lie. It provides a simple GUI to a complex Powershell script that actually does most of the work.
To understand how to use PAL, we need to look at it's 4 main components
- The Log file
- The Threshold File
- Questions
- The End Result
So, let's download PAL, fire up the GUI, and get to work!
Log Files
The Perfmon log file is where all PAL looks for data. A key advantage to using PAL is that you do not need to consider log size when you look at collecting your data. You can include all the counters you might need, and then instruct PAL to only analyse the ones you want and only during a specific time period. The only caveat to this is that PAL will not work as well if you have multiple computers feeding a single log file, as it will assume that the configuration of the machine is the same for each counter.
So, tell PAL where you log file is, and specify a time range for the data you want to analyse if you don't want to look at the whole file (if you have multiple files, we can add them later).
Threshold file
The threshold file is what makes PAL a useful tool. In essence, it's just a simple XML file used to define what kind of analysis you want PAL to do on your log files.
The first thing this file does is to define what counters you want to analyse, meaning you can skip any counters that you're not interested in or don't apply to your current problem.
Next, and the reason it is called a threshold file, it lets you set thresholds on each of your counters. This allows us to add some meaning to the data we have collected. We can define what value for each counter defines a warning state and what defines a critical state and so bring potential problems to our attention.
Finally, the threshold file allows you to specify questions to ask. We will come on to these shortly.
This may sound like a lot of work, but it doesn't have to be. PAL has a number of threshold files included that cover many of the common server configurations, e.g. Exchange, OCS, SQL, and a catch all, systems overview file. Using these built in threshold files, or by downloading additional ones from the Internet you can make extensive use of PAL without ever needing to write any code.
If these threshold files do not meet your needs, or you need one that is tailored to your needs, then PAL includes a GUI that assists you in doing just that. Selection of counters is done via the user interface. However, the calculations used to determine threshold values are written in Powershell, so some ability to write Powershell code is required.

If you haven't yet collected your Perfmon data, you can also use PAL to generate a Perfmon template from a threshold file, so that you only collect the data that this threshold file will generate.
Questions
The questions section asks you for some extra information about the machine this Perfmon log is for, for example number of CPU's, amount of memory etc. These questions are important, because the values you give can be accessed in the Powershell code inside the threshold files. These values can be used to assist in calculating your threshold levels.
Questions are configured inside the threshold file, and can be edited and added through the PAL GUI when creating a threshold file. When you add a question you create a Powershell variable that is available for use later inside threshold calculations.
Running the Analysis
Once you have selected your log, your threshold file, and answered some questions, you are ready to go. At this point, you add your job to the queue. You can then choose to either run this queue now or queue up more jobs to run in a batch. PAL analysis jobs can take a number of hours to run, depending on how much data is contained in your logs, so it is often convenient to queue up jobs to run overnight.
Ok! So, you've run your analysis and PAL has spat out some HTML files, how are these useful?
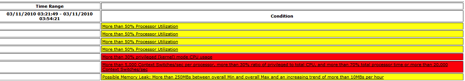
First off, for those in a rush or who want a quick overview of what problems there may be, there is the alerts section. This looks at the threshold values we had in our threshold file, and gives a visual indication of what areas of this log are in a warning, or critical state. It's very easy to quickly see where the machine is struggling, and where you may want to focus your efforts on fixing the problem.
Once you've been through all your alerts, we then have detailed information on all your selected counters. Each counter is presented separately, with a graph, alert details and statistics. Threshold data is also presented on each graph, allowing us to quickly see at what point there was an issue and how severe it was.
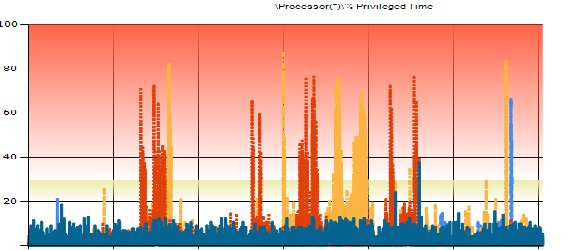
As you can see from this graph, this job is making the CPU a little unhappy at times and might be something that needs to be looked at!
Summary
Perfmon is a great tool for collecting performance data, but it sucks when it comes to actually analysing this data and getting some meaning from it. What looks like a big spike in the Perfmon viewer could actually be normal operation for that counter - we're missing some helpful context. We can use PAL to give us information that is not only easier to read but also has some meaning to it. From this, we can determine which data is normal and can safely be ignored, and which data is anomalous and is something that we need to investigate.
PAL is by no means perfect; getting useful reports out of this tool relies on having a threshold file that covers the counters you need to analyse with meaningful threshold calculations. If one of the included files, or one found on the internet covers this then that's great, but if not you are stuck needing to write your own using Powershell, which can be quite a complex task if you have lots of counters you want to analyse.
Users who need to analyse perfmon data alot will invest the time in customising their threshold files to get out exactly what they need, however more casual users are going to rely heavily on the pre-constructed files.
That said, more and more product areas are seeing the value in PAL and providing threshold files for their products, Exchange and OCS are two examples of this. There's no magic pixie dust in these threshold files. If you can understand Powershell, then you can write your own to handle any Counter that Perfmon can use, including third party ones. So it's a great option for people who need to analyse uncommon data. It's also open source, so if you want to see how the Powershell code behind the analysis, you can.
It's also not a quick process; log analysis can take hours. If you're looking for an immediate answer to your problem then you are going to have to use other methods of getting your answers.
If, however, you've got the right threshold file, and the time to run the analysis, then this can prove an invaluable tool to help you get meaning, and ultimately solve your problems, from Perfmon data.
Further reading:


No comments :
Post a Comment