
This was written by Corry Haines.
As your company grows, you may find that your existing metric collection system(s) cannot keep up. Alternately, you may find that the interface used to read those metrics does not work with everything that you want to collect retrics for.
The problems that I have seen with existing solutions that I have used are:
- Munin: Fails to scale in all respects. Collection is more complicated than it should be, and graphs are pre rendered for every defined time window. Needless to say, this does not scale well and cannot be used dynamically.
- Collectd: While this system is excellent at collecting data, the project does not officially support any frontend. This has led to a proliferation of frontend projects that, if taken together, have all of the features you need, but no one frontend does everything.
- XYMon: It's been some time since I used this, and I have not used it on a large set of systems. My guess is that it would suffer from some of Munin's issues.
Enter Graphite
Graphite is a collection of services that can replace or enhance your existing metric collection setup. Yes, it's written in python... but I like python.
The major components are:
- Whisper: Replaces RRD with a vastly simpler storage only system. Unlike RRD, whisper cannot graph data directly. Also unlike RRD, you can actually read and understand the entire codebase in less than an hour (only 725 lines of well commented python).
- Carbon: Takes data on a variety of interfaces (TCP, UDP, Pickle, AMQP) and stores the data into whisper.
- Graphite-webapp: Graphs data from whisper or RRD files.
The best thing about the components being independent is that you can run graphite on your existing RRD data with no hassle. While there are advantages to using whisper, it is not required to get the power of graphite.
The only negatives that I currently hold against graphite are:
- The documentation is still a bit lacking, though they are working to improve this. You can invoke the community (mailing lists, etc) as a workaround.
- The learning curve can be a bit steep. While there is an interface to see all of the functions, you still need to learn how they are applied. This is offset by the ability to save named graphs for all users to see.
- Feedback is a bit lacking. After a graph is requested it is difficult to tell if it is being rendered, or simply failed in the backend.
- They use launchpad and thus bazaar, for their project management and source control. In a post-github world, this is starting to get a bit painful.
The Power of Filters and Functions
As wonderful as whisper and carbon are (and they really are worth using), the true power of graphite lies in its web interface. Unlike some other interfaces, graphite treats each metric as an independent data series. So long as you have an understanding of the system, you can apply functions (think sum, avg, stddev, etc.) to the metrics either by themselves, or more often, in aggregate.
In addition, you can use wildcards to select multiple machines quickly. While you could do a sum operation like this: sumSeries(host1.load,host2.load,etc) you could more easily type sumSeries(*.load).
Filter Example
As an example, if I wanted to find overloaded webservers I could construct a query like highestAverage(webservers.*.load.longterm, 3) producing:
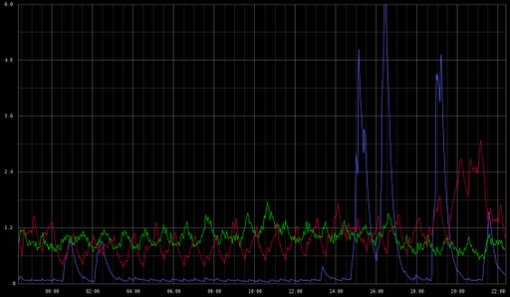
Stacking example
Another example, graphing the amount of unused memory on the webservers (time for more memcached if so!) movingAverage(webservers.*.memory.free, 10) producing:

Note that I am also creating a moving average over 10 datapoints here. Also, the series are stacked to produce a sum while still showing the responsible server
Functions Are the Best!
And this is only a small selection of the functions available to you. Moreover, you can write your own! And easily too! Here is an example function in graphite:
# A function to scale up all datapoints by a given factor
def scale(requestContext, seriesList, factor):
  for series in seriesList:
    series.name = "scale(%s,%.1f)" % (series.name,float(factor))
    for i,value in enumerate(series):
      series[i] = safeMul(value,factor)
  return seriesList
Graphite in Production
We are currently collecting >93,000 metrics every 10 seconds. Most of the data is gathered on machines using collectd and then passed to a proxy written by sysadvent's editor. The proxy then ships all of the data, via TCP, to our central Carbon node.
All of the data is consumed by carbon and stored on a single machine with six 10k SAS drives in a RAID 10 array. Although this disk setup is not enough to write the data in real time, it batches up the data and writes sets at once. It only needs to use about 300 MB of RAM for caching.
In reality, this hardware is probably overkill for our current workload. While testing, I was running about 50,000 metrics on four 7.2k SATA drives in a RAID 10 and the machine was doing just fine. It was using several GB of RAM to cache the data, but it was still able to keep up.
In Closing
If you are considering the installation of a metric gathering system, I would absolutely recommend Graphite. If you are using Collectd or Munin already, you can try the graphite web interface without changing how you collect metrics. It only takes a few minutes to setup and might give you better insight into your systems.


2 comments :
Hi Corey,
thanks for the great article. Full of chuck full tips.
You show a custom function in graphite. I wonder where you integrate those functions? Is this somewhere in a config file, somewhere in the code directly?
thanks for clarifying that,
Patrick
Hackernews discussion for this post:
https://news.ycombinator.com/item?id=8907797
Post a Comment