Showing posts with label automation. Show all posts

December 15, 2021

Day 15 - Introduction to the PagerDuty API

By: Mandi Walls (@lnxchk)
Edited by: Joe Block (@curiousbiped)

Keeping track of all the data generated by a distributed ecosystem is a daunting task. When something goes wrong, or a service isn’t behaving properly, tracking down the culprit and getting the right folks enabled to fix it is also challenging. PagerDuty can help you with these challenges.

The PagerDuty platform integrates with over 600 other components to gather data, add context, and process automation. Under the hood of all of these integrations is the PagerDuty API, ready to help you programmatically interact with your PagerDuty account.

What’s Exposed Via the API

The PagerDuty API provides access to all the structural objects in your PagerDuty account - users, teams, services, escalation policies, etc - and also to the data objects including incidents, events, and change events.

For objects like users, teams, escalation policies, schedules, and services, you may find using the PagerDuty Terraform Provider will help you maintain the state of your account more efficiently without using the API directly.

The other object types in PagerDuty are more useful when we can send them anytime from anywhere, including via the API from our own code. Let’s take a look at three of them: incidents, events, and change events. If you’d like a copy of the code for these examples, you can find them on Github.

API Basics

To write new information into PagerDuty via the API, you'll need some authorization. You can use OAuth, or create an API key. There are account-level and user-level API keys available. You'll use the account-level keys for the rest of the examples here and keep things simple.

To create a key in your PagerDuty app, you'll need Admin, Global Admin, or Account Owner access to your account. More on that here.

In PagerDuty, navigate to Integrations and then chose API Access Keys. Create a new key, give it a description, and save it somewhere safe. The keys are strings that look like y_NbAkKc66ryYTWUXYEu.

Now you’re ready to generate some incidents! These examples use curl, but there are a number of client libraries for the API as well.

Incidents

Incidents are probably what you’re most familiar with in PagerDuty - they represent a problem or issue that needs to be addressed and resolved. Sometimes this includes alerting a human responder. Many of the integrations in the PagerDuty ecosystem generate incidents from other systems and services to send to PagerDuty.

In PagerDuty, incidents are assigned explicitly to services in your account, so an incoming incident will register with only that service. If your database has too many long-running queries, you want an incident to be assigned to the PagerDuty service representing that database so responders have all the correct context to fix the issue.

If you have a service that doesn’t have an integration out of the box, you can still get information from that service into PagerDuty via the API, and you don’t need anything special to do it. You can send an incident to the API via a curl request to the https://api.pagerduty.com/incidents endpoint.

There are three required headers for these requests, Accept, Content-Type and From, which needs to be an email address associated with your account, for attribution of the incident. Setting up the request will look something like:


curl -X POST --header 'Content-Type: application-json' \
--url https://api.pagerduty.com/incidents \
--header 'Accept: application/vnd.pagerduty+json;version=2' \
--header 'Authorization: Token token=y_NbAkKc66ryYTWUXYEu' \
--header 'From: system2@myemail.com' \

Now you need the information bits of the incident. These will be passed as --data in the curl request. There are just a few required pieces to set up the format and a number of optional pieces that help add context to the incident.

The most important piece you'll need is the service ID. Every object in the PagerDuty platform has a unique identifier. You can find the ID of a service in its URL in the UI. It will be something like https://myaccount.pagerduty.com/service-directory/SERVICEID.

Now you can create the rest of the message with JSON:


curl -X POST --header 'Content-Type: application/json' \
--url https://api.pagerduty.com/incidents \
--header 'Accept: application/vnd.pagerduty+json;version=2' \
--header 'Authorization: Token token=y_NbAkKc66ryYTWUXYEu' \
--header 'From: system2@myemail.com' \
--data '{
  "incident": {
    "type": "incident",
    "title": "Too many blocked requests",
    "service": {
      "id": "PWIXJZS",
      "summary": null,
      "type": "service_reference",
      "self": null,
      "html_url": null
    },
    "body": {
      "type": "incident_body",
      "details": "The service queue is full. Requests are no longer being fulfilled."
    }
  }
}'

When you run this curl command, it will generate a new incident on the service PWIXJZS with the title "To many blocked requests", along with some context in the "body" of the data to help our responders. You can add diagnostics or other information here to help your team fix whatever is wrong.

What if there is information being generated that might not need an immediate response? Instead of an incident, you can create an event.

Events

Events are non-alerting items sent to PagerDuty. They can be processed via Event Rules to help create context on incidents or provide information about the behavior of your services. They utilize the PagerDuty Common Event Format to make processing and collating more effective.

Events are registered to a particular routing_key via an integration on a particular service in your PagerDuty account. In your PagerDuty account, select a service you'd like to send events to, or create new one to practice with. On the page for that service, select the Integrations tab and Add an Integration. For this integration, select "Events API V2" and click Add. You'll have a new integration on your service page. Click the gear icon, and copy the Integration Key. For the full walkthrough of this setup, see the docs.

The next step is to set up the event. The request is a little different from the incident request - the url is different, the From: header is not required, and the authorization is completely handled in the routing_key instead of using an API token.

The content of the request is more structured, based on the Common Event Format, so that you can create event rules and take actions if necessary based on what the events contain.


curl --request POST \
  --url https://events.pagerduty.com/v2/enqueue \
  --header 'Content-Type: application/json' \
  --data '{
  "payload": {
    "summary": "DISK at 99% on machine prod-datapipe03.example.com",
    "timestamp": "2021-11-17T08:42:58.315+0000",
    "severity": "critical",
    "source": "prod-datapipe03.example.com",
    "component": "mysql",
    "group": "prod-datapipe",
    "class": "disk",
    "custom_details": {
      "free space": "1%",
      "ping time": "1500ms",
      "load avg": 0.75
    }
  },
  “event_action”: “trigger”,
  "routing_key": "e93facc04764012d7bfb002500d5d1a6"
}'

Change Events

A third type of contextual data you can send to the API is a Change Event. Change events are non-alerting, and help add context to a service. They are informational data about what's changing in your environment, and while they don't generate an incident, they can inform responders about other activities in the system that might have contributed to a running incident. Change events might come from build and deploy services, infrastructure as code, security updates, or other places that change is generated in your environment.

These events have a similar basic structure to the general events, and the setup with the routing_key is the same, as you can see in the below example. The custom_details can contain anything you want, like the build number, a link to the build report, or the list of objects that were changed during an Infrastructure as Code execution.

Change events have a time horizon. They expire after 90 days in the system, so you aren't looking at old context based on past changes.


curl --request POST \
  --url https://events.pagerduty.com/v2/change/enqueue \
  --header 'Content-Type: application/json' \
  --data '{
  "routing_key": "737ea619db564d41bd9824063e1f6b08",
  "payload": {
    "summary": "Build Success: Increase snapshot create timeout to 30 seconds",
    "timestamp": "2021-11-17T09:42:58.315+0000",
    "source": "prod-build-agent-i-0b148d1040d565540",
    "custom_details": {
      "build_state": "passed",
      "build_number": "220",
      "run_time": "1236s"
    }
  }
}'

Adding Notes

One final fun bit of functionality you can leverage in PagerDuty's API is with notes. Notes are short text entries added to the timeline of an incident. In some integrations, like PagerDuty and Slack, notes will be sent to any Slack channel that is configured to receive updates for an impacted service, making them helpful for responders to coordinate and record activity across different teams.

Notes are associated with a specific incident, so when you are creating a note, the url will include the incident ID. Incident IDs are similar to the other object IDs in PagerDuty in that you can find them from the URL of the incident in the UI. They are longer strings than other objects than the service ID in the examples above.

The content of a note can be anything that might be interesting to the timeline of the incident, like commands that have been run, notifications that have been sent, or additional data and links for responders and stakeholders.


curl --request POST \
  --url https://api.pagerduty.com/incidents/{id}/notes \
  --header 'Accept: application/vnd.pagerduty+json;version=2' \
  --header 'Authorization: Token token=y_NbAkKc66ryYTWUXYEu' \
  --header 'Content-Type: application/json' \
  --header 'From: responder2@myemail.com' \
  --data '{
  "note": {
    "content": "Firefighters are on the scene."
  }
}'

Responders utilizing the UI will see notes in a widget on the incident pag.

Next Steps

Using the API to create tooling where integrations don't yet exist, or for internally-developed services, can help your team stay on top of all the moving parts of your ecosystem when you have an incident. Learn more about the PagerDuty resources available at https://developer.pagerduty.com/. Join the PagerDuty Community to learn from other folks working in PagerDuty, ask questions, and get answers.

December 13, 2021

Day 13 - Ephemeral PR Environments: Enabling automated testing at a rapid pace

By: Amar Sattaur
Edited by: Jennifer Davis (@sigje)

Recently, I've been thinking a lot about how to implement the concepts of least privilege while also speeding up the feedback cycle in the developer workflow. However, these two things are not very quickly intertwined. Therefore, there needs to be underlying tooling and visibility to show developers the data they need for a successful PR merge.

A developer doesn't care about what those underlying tools are; they just want access to a system where they can:

  • See the logs of the app that they're making a change for and the other relevant apps
  • See the metrics of their app so they can adequately gauge performance impact

One way to achieve this is with ephemeral environments based on PR's. The idea is that the developer opens up a PR and then automatically a new environment is spun up based on provided defaults with the conditions that the environment is:

  • deployed in the same way that dev/stage/prod are deployed, just with a few key elements different
  • labeled correctly so that the NOC/Ops teams know the purpose of these resources
  • Integrated with logging/metrics and useful tags so that the engineer can easily see metrics for this given PR build

That sounds like a daunting task but through the use of Kubernetes, Helm, a CI Platform (GitHub Actions in this tutorial) and ArgoCD, you can make this a reality. Let's look at an example application leveraging all of this technology.

Example app

You can find all the code readily available in this GitHub Repo.

Pre-requisites Used in this Example

Tool Version
kubectl v1.21
Kubernetes Cluster v1.20.9
Helm v3.6.3
ArgoCD v2.0.5
kube-prometheus-stack v0.50.0

The example app that you’re going to deploy today is a Prometheus exporter that exports a custom metric with an overridable label set:

  • The `version` of the deployed app
  • The `branch` of the PR
  • The PR ID

Pipeline

Now that I've defined the goal, let's go a little more in-depth on how you'll get there. First, let's take a look at the PR pipeline in .github/workflows/pull_requests.yml:


---
name: 'Build image and push PR image to ghcr'
on:
  pull_request:
    types: [assigned, opened, synchronize, reopened]
    branches:
      - main

jobs:
  build:
    name: Build
    runs-on: ubuntu-latest
    steps:
      - name: Checkout
        uses: actions/checkout@v2
      - name: Build image
        uses: docker/build-push-action@v1
        with:
          registry: ghcr.io
          username: ${{ github.repository_owner }}
          password: ${{ secrets.GITHUB_TOKEN }}
          tags: PR-${{ github.event.pull_request.number }}
       

This pipeline runs on pull requests events to the main branch. So, when you open a PR, push a commit to an existing PR, reopen a closed PR, or assign it to a user, this pipeline will get triggered. It defines two workflows, the first of which is build. It's relatively straightforward: take the Dockerfile that lives in the root of your repo and build a container image out of it and tag it for use with GitHub Container Registry. The tag is the PR ID of the triggering pull request.

The second workflow is the one where we deploy to ArgoCD:


 deploy:
    needs: build
    container: ghcr.io/jodybro/argocd-cli:1.1.0
    runs-on: ubuntu-latest
    steps:
      - name: Log into argocd
        run: |
          argocd login ${{ secrets.ARGOCD_GRPC_SERVER }} --username ${{ secrets.ARGOCD_USER }} --password ${{ secrets.ARGOCD_PASSWORD }}
      - name: Deploy PR Build
        run: |
          argocd app create sysadvent2021-pr-${{ github.event.pull_request.number }} \
            --repo https://github.com/jodybro/sysadvent2021.git \
            --revision ${{ github.head_ref }} \
            --path . \
            --upsert \
            --dest-namespace argocd \
            --dest-server https://kubernetes.default.svc \
            --sync-policy automated \
            --values values.yaml \
            --helm-set version="PR-${{ github.event.pull_request.number }}" \
            --helm-set name="sysadvent2021-pr-${{ github.event.pull_request.number }}" \
            --helm-set env[0].value="PR-${{ github.event.pull_request.number }}" \
            --helm-set env[1].value="${{ github.head_ref }}" \
            --helm-set env[2].value="sysadvent2021-pr-${{ github.event.pull_request.number }}"
       

This workflow runs a custom image that I wrote that wraps the argocd cli tool in a container and allows for arbitrary commands to be executed against an authenticated ArgoCD instance.

It then creates a Kubernetes object of kind: Application which is a CRD that ArgoCD deploys into your cluster to define where you want to pull the application from and how to deploy it (helm/kustomize etc..).

Putting it all together

Now, let's see this pipeline in action. First, head to your repo and create a PR against the main branch with some changes; it doesn't matter what the changes are as all PR events will trigger the pipeline.

You can see that my PR has triggered a pipeline which can be viewed here. Furthermore, you can see that this pipeline was executed successfully, so if I go to my ArgoCD instance, I would see an application with this PR ID.

So, if you are following along, now you have two deployments of this example app, one should show labels for the main branch, and one should show labels for the PR branch.

Let's verify by port-forwarding to each and see what you get back.

Main branch

First, let's check out the main branch application:


kubectl port-forward service/sysadvent2021-main 8000:8000 
Forwarding from 127.0.0.1:8000 -> 8000
Forwarding from [::1]:8000 -> 8000
       

As you can see, the branch is set to main with the correct version.

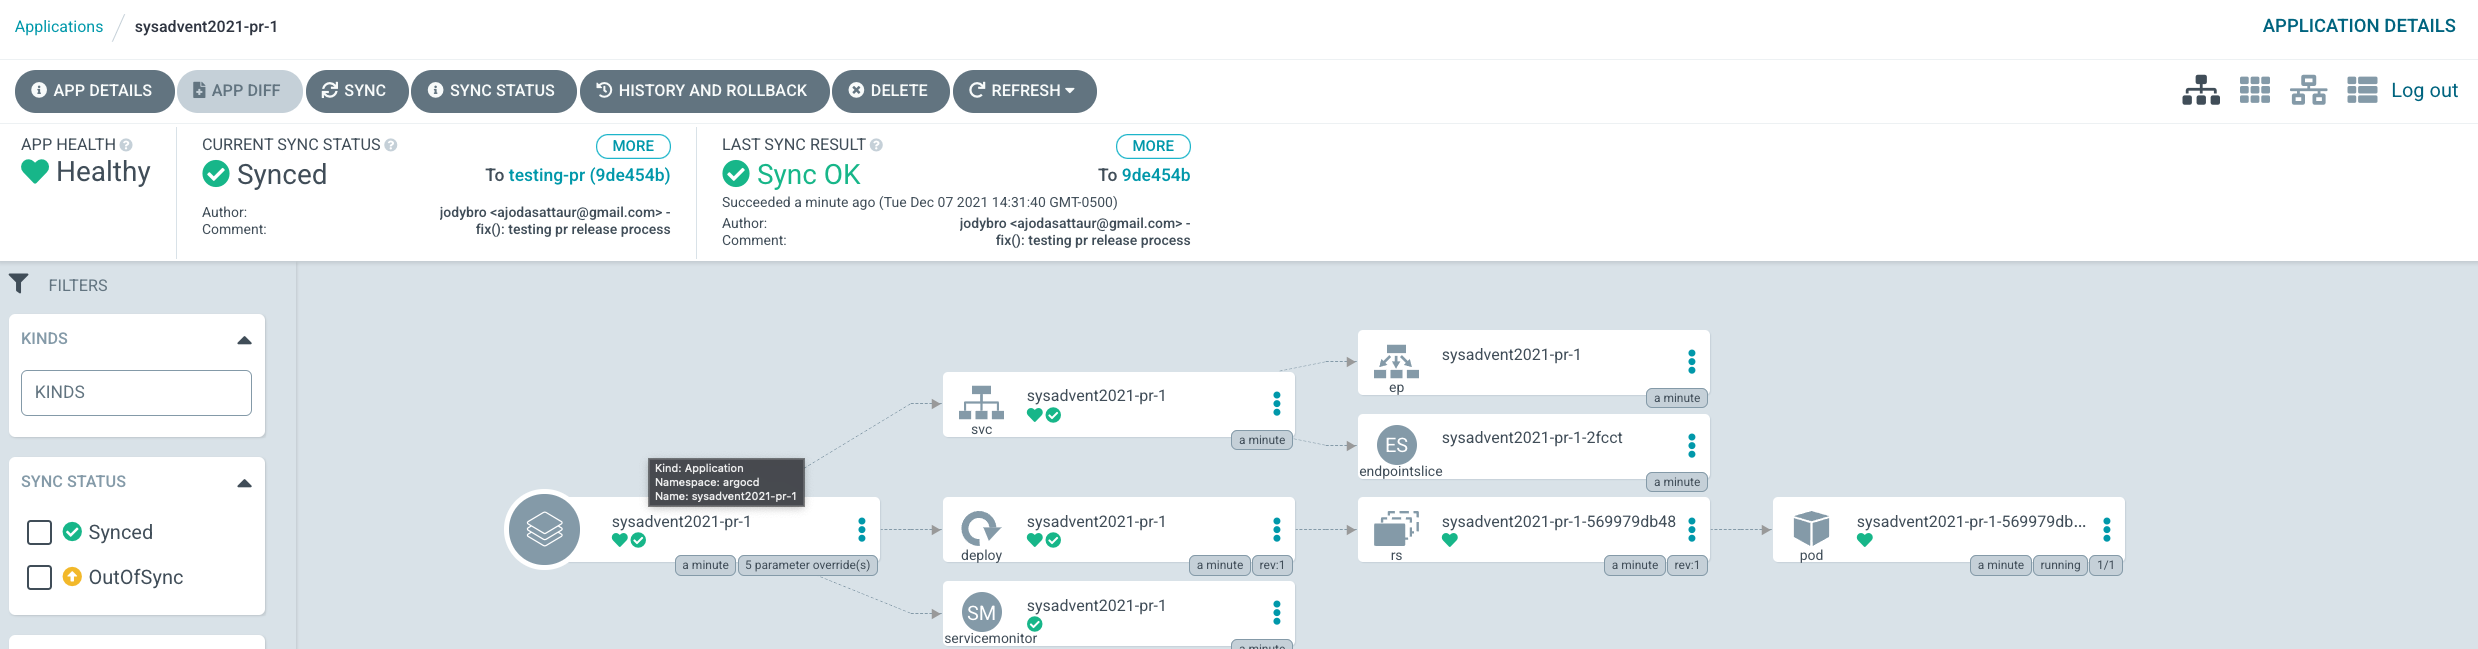
And if you check out the state of our Application in ArgoCD:

Everything is healthy!

PR

Now let's check the PR deployment:


kubectl port-forward service/sysadvent2021-pr-1 8000:8000 
Forwarding from 127.0.0.1:8000 -> 8000
Forwarding from [::1]:8000 -> 8000
       

This one's labels are showing the branch and the version from the PR.

This pod returns:

And in ArgoCD:

Final thoughts

It really is that easy to get PR environments running in your company!

Resources

* Source Code Repo

December 19, 2013

Day 19 - Automating IAM Credentials with Ruby and Chef

Written by: Joshua Timberman (@jtimberman)
Edited by: Shaun Mouton (@sdmouton)

Chef, nee Opscode, has long used Amazon Web Services. In fact, the original iteration of "Hosted Enterprise Chef," "The Opscode Platform," was deployed entirely in EC2. In the time since, AWS has introduced many excellent features and libraries to work with them, including Identity and Access Management (IAM), and the AWS SDK. Especially relevant to our interests is the Ruby SDK, which is available as the aws-sdk RubyGem. Additionally, the operations team at Nordstrom has released a gem for managing encrypted data bags called chef-vault. In this post, I will describe how we use the AWS IAM feature, how we automate it with the aws-sdk gem, and store secrets securely using chef-vault.

Definitions

First, here are a few definitions and references for readers.
  • Hosted Enterprise Chef - Enterprise Chef as a hosted service.
  • AWS IAM - management system for authentication/authorization to Amazon Web Services resources such as EC2, S3, and others.
  • AWS SDK for Ruby - RubyGem providing Ruby classes for AWS services.
  • Encrypted Data Bags - Feature of Chef Server and Enterprise Chef that allows users to encrypt data content with a shared secret.
  • Chef Vault - RubyGem to encrypt data bags using public keys of nodes on a chef server.

How We Use AWS and IAM

We have used AWS for a long time, before the IAM feature existed. Originally with The Opscode Platform, we used EC2 to run all the instances. While we have moved our production systems to a dedicated hosting environment, we do have non-production services in EC2. We also have some external monitoring systems in EC2. Hosted Enterprise Chef uses S3 to store cookbook content. Those with an account can see this with knife cookbook show COOKBOOK VERSION, and note the URL for the files. We also use S3 for storing the packages from our omnibus build tool. The omnitruck metadata API service exposes this.

All these AWS resources - EC2 instances, S3 buckets - are distributed across a few different AWS accounts. Before IAM, there was no way to have data segregation because the account credentials were shared across the entire account. For (hopefully obvious) security reasons, we need to have the customer content separate from our non-production EC2 instances. Similarly, we need to have the metadata about the omnibus packages separate from the packages themselves. In order to manage all these different accounts and their credentials which need to be automatically distributed to systems that need them, we use IAM users, encrypted data bags, and chef.

Unfortunately, using various accounts adds complexity in managing all this, but through the tooling I'm about to describe, it is a lot easier to manage now than it was in the past. We use a fairly simple data file format of JSON data, and a Ruby script that uses the AWS SDK RubyGem. I'll describe the parts of the JSON file, and then the script.

IAM Permissions

IAM allows customers to create separate groups which are containers of users to have permissions to different AWS resources. Customers can manage these through the AWS console, or through the API. The API uses JSON documents to manage the policy statement of permissions the user has to AWS resources. Here's an example:
{
  "Statement": [
    {
      "Action": "s3:*",
      "Effect": "Allow",
      "Resource": [
        "arn:aws:s3:::an-s3-bucket",
        "arn:aws:s3:::an-s3-bucket/*"
      ]
    }
  ]
}
Granted to an IAM user, this will allow that user to perform all S3 actions to the bucket an-s3-bucket and all the files it contains. Without the /*, only operations against the bucket itself would be allowed. To set read-only permissions, use only the List and Get actions:
"Action": [
  "s3:List*",
  "s3:Get*"
]
Since this is JSON data, we can easily parse and manipulate this through the API. I'll cover that shortly.

See the IAM policy documentation for more information.

Chef Vault

We use data bags to store secret credentials we want to configure through Chef recipes. In order to protect these secrets further, we encrypt the data bags, using chef-vault. As I have previously written about chef-vault in general, this section will describe what we're interested in from our automation perspective.

Chef vault itself is concerned with three things:
  1. The content to encrypt.
  2. The nodes that should have access (via a search query).
  3. The administrators (human users) who should have access.
"Access" means that those entities are allowed to decrypt the encrypted content. In the case of our IAM users, this is the AWS access key ID and the AWS secret access key, which will be the content to encrypt. The nodes will come from a search query to the Chef Server, which will be added as a field in the JSON document that will be used in a later section. Finally, the administrators will simply be the list of users from the Chef Server.

Data File Format

The script reads a JSON file, described here:
{
  "accounts": [
    "an-aws-account-name"
  ],
  "user": "secret-files",
  "group": "secret-files",
  "policy": {
    "Statement": [
      {
        "Action": "s3:*",
        "Effect": "Allow",
        "Resource": [
          "arn:aws:s3:::secret-files",
          "arn:aws:s3:::secret-files/*"
        ]
      }
    ]
  },
  "search_query": "role:secret-files-server"
}
This is an example of the JSON we use. The fields:
  • accounts: an array of AWS account names that have authentication credentials configured in ~/.aws/config - see my post about managing multiple AWS accounts
  • user: the IAM user to create.
  • group: the IAM group for the created user. We use a 1:1 user:group mapping.
  • policy: the IAM policy of permissions, with the action, the effect, and the AWS resources. See the IAM documentation for more information about this.
  • search_query: the Chef search query to perform to get the nodes that should have access to the resources. For example, this one will allow all nodes that have the Chef role secret-files-server in their expanded run list.
These JSON files can go anywhere, the script will take the file path as an argument.

Create IAM Script

Note This script is cleaned up to save space and get to the meat of it. I'm planning to make it into a knife plugin but haven't gotten a round tuit yet.
require 'inifile'
require 'aws-sdk'
require 'json'
filename = ARGV[0]
dirname  = File.dirname(filename)
aws_data = JSON.parse(IO.read(filename))
aws_data['accounts'].each do |account|
  aws_creds = {}
  aws_access_keys = {}
  # load the aws config for the specified account
  IniFile.load("#{ENV['HOME']}/.aws/config")[account].map{|k,v| aws_creds[k.gsub(/aws_/,'')]=v}
  iam = AWS::IAM.new(aws_creds)
  # Create the group
  group = iam.groups.create(aws_data['group'])
  # Load policy from the JSON file
  policy = AWS::IAM::Policy.from_json(aws_data['policy'].to_json)
  group.policies[aws_data['group']] = policy
  # Create the user
  user = iam.users.create(aws_data['user'])
  # Add the user to the group
  user.groups.add(group)
  # Create the access keys
  access_keys = user.access_keys.create
  aws_access_keys['aws_access_key_id'] = access_keys.credentials.fetch(:access_key_id)
  aws_access_keys['aws_secret_access_key'] = access_keys.credentials.fetch(:secret_access_key)
  # Create the JSON content to encrypt w/ Chef Vault
  vault_file = File.open("#{File.dirname(__FILE__)}/../data_bags/vault/#{account}_#{aws_data['user']}_unencrypted.json", 'w')
  vault_file.puts JSON.pretty_generate(
    {
      'id' => "#{account}_#{aws_data['user']}",
      'data' => aws_access_keys,
      'search_query' => aws_data['search_query']
    }
  )
  vault_file.close
  # This would be loaded directly with Chef Vault if this were a knife plugin...
  puts <<-eoh data-blogger-escaped---admins="" data-blogger-escaped---json="" data-blogger-escaped---mode="" data-blogger-escaped---search="" data-blogger-escaped--="" data-blogger-escaped--sd="" data-blogger-escaped-account="" data-blogger-escaped-admins="" data-blogger-escaped-aws_data="" data-blogger-escaped-be="" data-blogger-escaped-client="" data-blogger-escaped-code="" data-blogger-escaped-create="" data-blogger-escaped-data_bags="" data-blogger-escaped-encrypt="" data-blogger-escaped-end="" data-blogger-escaped-eoh="" data-blogger-escaped-humans="" data-blogger-escaped-knife="" data-blogger-escaped-list="" data-blogger-escaped-of="" data-blogger-escaped-paste="" data-blogger-escaped-search_query="" data-blogger-escaped-should="" data-blogger-escaped-unencrypted.json="" data-blogger-escaped-user="" data-blogger-escaped-vault="" data-blogger-escaped-who="">
This is invoked with:
% ./create-iam.rb ./iam-json-data/filename.json
The script iterates over each of the AWS account credentials named in the accounts field of the JSON file named, and loads the credentials from the ~/.aws/config file. Then, it uses the aws-sdk Ruby library to authenticate a connection to AWS IAM API endpoint. This instance object, iam, then uses methods to work with the API to create the group, user, policy, etc. The policy comes from the JSON document as described above. It will create user access keys, and it writes these, along with some other metadata for Chef Vault to a new JSON file that will be loaded and encrypted with the knife encrypt plugin.

As described, it will display a command to copy/paste. This is technical debt, as it was easier than directly working with the Chef Vault API at the time :).

Using Knife Encrypt

After running the script, we have an unencrypted JSON file in the Chef repository's data_bags/vault directory, named for the user created, e.g., data_bags/vault/secret-files_unencrypted.json.
{
  "id": "secret-files",
  "data": {
    "aws_access_key_id": "the access key generated through the AWS API",
    "aws_secret_access_key": "the secret key generated through the AWS API"
  },
  "search_query": "roles:secret-files-server"
}
The knife encrypt command is from the plugin that Chef Vault provides. The output of the create-iam.rb script outputs how to use this:
% knife encrypt create vault an-aws-account-name_secret-files \
  --search 'roles:secret-files-server' \
  --mode client \
  --json data_bags/vault/an-aws-account-name_secret-files_unencrypted.json \
  --admins "`knife user list | paste -sd ',' -`"

Results

After running the create-iam.rb script with the example data file, and the unencrypted JSON output, we'll have the following:
  1. An IAM group in the AWS account named secret-files.
  2. An IAM user named secret-files added to the secret-files.
  3. Permission for the secret-files user to perform any S3 operations
    on the secret-files bucket (and files it contains).
  4. A Chef Data Bag Item named an-aws-account-name_secret-files in the vault Bag, which will have encrypted contents.
  5. All nodes matching the search roles:secret-files-server will be present as clients in the item an-aws-account-name_secret-files_keys (in the vault bag).
  6. All users who exist on the Chef Server will be admins in the an-aws-account-name_secret-files_keys item.
To view AWS access key data, use the knife decrypt command.
% knife decrypt vault secret-files data --mode client
vault/an-aws-account-name_secret-files
    data: {"aws_access_key_id"=>"the key", "aws_secret_access_key"=>"the secret key"}
The way knife decrypt works is you give it the field of encrypted data to encrypt which is why the unencrypted JSON had a field named data created - so we could use that to access any of the encrypted data we wanted. Similarly, we could use search_query instead of data to get the search query used, in case we wanted to update the access list of nodes.

In a recipe, we use the chef-vault cookbook's chef_vault_item helper method to access the content:
require 'chef-vault'
aws = chef_vault_item('vault', 'an-aws-account_secret-files')['data']

Conclusion

I wrote this script to automate the creation of a few dozen IAM users across several AWS accounts. Unsurprisingly, it took longer to test the recipe code and access to AWS resources across the various Chef recipes, than it took to write the script and run it.

Hopefully this is useful for those who are using AWS and Chef, and were wondering how to manage IAM users. Since this is "done" I may or may not get around to releasing a knife plugin.

December 11, 2013

Day 11 - The Lazy SysAdmin's Guide to Test Driven Chef Cookbooks

Written By: Paul Czarkowski (@pczarkowski)
Edited By: Shaun Mouton (@sdmouton)

This article assumes you have some knowledge of Chef and the Berkshelf way of managing cookbooks. If you do not, then I highly recommend you watch the Chefconf talk on 'The Berkshelf Way' before reading further.

What even is?

The Lazy Sysadmin is a person who is not lazy in the regular sense, but is lazy in the sense that they don't want to do the same thing twice, or in this specific case they don't want to be woken up at two in the morning by PagerDuty (I hate that guy!) for an issue caused by a bug in a chef cookbook.

A lot of config management code is tested briefly in Vagrant (if at all) by simply checking that it ran without an error and the service that you wrote the cookbook for is running. Maybe it spends a little while in a staging environment, but will often head to production with that minimum of testing.

I don't always test my code...

We can borrow a methodology from the developer community called Test Driven Development which helps reduce the feedback loop to just a few seconds after writing code. This does mean some extra up front work but in my opinion the payoff makes it worth that investment.

Test Driven Development (TDD) has been around for a long time and is heavily embraced in the Ruby developer community. The basic idea of it is to provide feedback to the developer as early as possibly as to whether their code is working via unit tests. In TDD the person writing the code often writes the (failing) unit test first, and then writes the code to make that test pass. There is also the concept of README Driven Development (RDD) which is where you write the documentation even before that.

This article explores these two concepts and some tooling that assists to bring this workflow of Document -> Test -> Code to chef cookbooks. This can feel very awkward at first, and chefspec especially can take a while to really grok (I'm not there yet, but it's getting easier). We'll explore a few ways to help make that transition.

The tools that I am using were decided for me by the stackforge chef cookbooks which already had a unit-testing framework defined when I started working with them. There are likely other tools out there that do similar things (e.g. bats vs minitest vs chefspec) so do not feel constrained by the tools I talk about, instead focus on the concepts.

It's important to mention here that this is a flexible framework and if you want to write the code, then the tests, then documentation that's fine as well, and in fact that's how I started off. As I got more comfortable with the ideas and tools I slowly moved to mostly following the workflow of Documentation -> Test -> Code, but there are still times where I write very loose documentation followed by some draft code then finally go back and document and write tests.

README Driven Development (RDD)

Every chef cookbook should have a README.md file in its root that acts as its documentation. This should be the first place you start, and by happy chance if you create a new cookbook with Berkshelf (use berks cookbook new_cookbook for this) it will create a very serviceable skeleton README.md file for you to use. I use a different format which you'll see later but that's just personal preference.

I start by writing the LICENSE file (I usually use the Apache 2.0 license). It's very important to let others know what license you're releasing the cookbook under as some companies have policies against using specific licenses (or code with no license specified) for legal protection.

Next I start filling out the README.md. For example I have a Rails application that uses sqlite3 for the development environment so my cookbook may start off having just a single recipe (not counting default) called application. There are some obvious dependencies and attributes to set, so I'll document those at this point as well.

Obviously you won't know beforehand about every tiny detail, so start by documenting loosely and then tighten it up as you go. For example my application uses docker, but I'll add that into the cookbook after I've got my base rails application installed, which means I can wait until I'm about to implement that before I write the documentation for it.

README.md


Requirements
============

Chef 0.11.0 or higher required (for Chef environment use).

Cookbooks
---------

The following cookbooks are dependencies:
* ruby
* git

Recipes
=======

ircaas::application
-------------------

* creates user `ircaas`
* includes recipes `git::default`, `ruby::default`
* Install IRCaaS Application code from `https://github.com/paulczar/ircaas`

Attributes
==========

ircaas['user'] - user to run application as
ircaas['git']['repo'] - repo containing IRCaaS code
ircaas['git']['branch'] - Branch to download
The final file to edit as part of RDD is metadata.rb which has optional methods to document recipes, attributes, etc as well. I try not to double up this information, so unless it is actually needed for the cookbook to run (such as dependencies) I leave them out. It's fine If you prefer to add it in both locations, or prefer to document in the metadata file, whichever you do just try to leave breadcrumbs for the reader to follow (for example, write 'see metatadata.rb under the appropriate sections.' in the README.md).

metadata.rb


name 'ircaas'
maintainer 'Paul Czarkowski'
maintainer_email 'username.taken@gmail.com'
license 'All rights reserved, Paul Czarkowski' # see './LICENSE' 
description 'Installs/Configures ircaas'
long_description IO.read(File.join(File.dirname(__FILE__), 'README.md'))
version '0.1.0'

%w{ ubuntu }.each do |os|
 supports os
end

%w{ ruby git }.each do |dep|
 depends dep
end

Test Driven Development (TDD)

Now that we've documented our first stage of the cookbook we want to write some tests for it, but first we need to set up the tooling. Most of the tools in the testing framework that we're installing are rubygems and can quickly suck you into dependency hell. To help deal with that and provide myself with some consistency I have created a Git repository called meez that contains my (very opinionated) skeleton cookbook and has a Gemfile and Gemfile.lock to help deal with the dependencies. I also have a base Berksfile, Vagrantfile, and Strainerfile, and I use Ruby 1.9.3 as my default ruby environment.

With this skeleton in place I can get up to speed very quickly by cloning the repo and running bundler which will install all the tools I need for testing which are described below.

git clone https://github.com/paulczar/meez.git chef-ircaas
cd chef-ircaas
bundle install

Strainer

A framework for testing chef cookbooks. It doesn't perform any tests itself, but instead calls a series of tools which are listed in a Strainerfile, as below:

# Strainerfile
tailor: bundle exec tailor
knife test: bundle exec knife cookbook test $COOKBOOK
foodcritic: bundle exec foodcritic -f any -t $SANDBOX/$COOKBOOK
chefspec: bundle exec rspec $SANDBOX/$COOKBOOK/spec

Tailor

Tailor reads Ruby files and measures them against some common ruby style guides. This is the tool that I'm least familiar with out of the set, but the framework I 'borrowed' from the stackforge cookbooks included it and I saw no reason to remove it.

knife cookbook test

Tests cookbook for syntax errors. this uses the built-in ruby syntax checking option for files in the cookbook ending in .rb, and the erb syntax check for files ending in .erb (templates). This comes free with knife.

foodcritic

Foodcritic is a linting tool for chef cookbooks. It parses your cookbook and comments on your styling as well as flagging known problems that would cause chef to break when converging. There is an excellent library of errors and Foodcritic will kindly provide an error code and often will even tell you how to fix it.
Example: FC002: Avoid string interpolation where not required

rubocop

I have just recently added this to my testing framework. It is a very verbose lint / style parser for Ruby. Prepare for it to yell at you a bunch when you start using it.

guard

I'm not using this yet, but it's a tool that watches files for changes and then runs commands against those files. This will allow for real time feedback of changes to files. Some potential uses for this that I plan to investigate are:
  • watch Berksfile and metadata.rb to automatically download any new cookbook dependencies.
  • watch Gemfile to automatically install any new Gem dependencies.
  • watch *.rb files to automatically check syntax/linting.

chefspec

ChefSpec is a unit testing framework for Chef cookbooks. It is an extension of RSpec and the version I use (ChefSpec 3.x) requires Ruby 1.9+ and Chef 11+.

ChefSpec runs your cookbook locally with Chef Solo but doesn't actually converge. This means it's very fast and it doesn't mess up your system by actually installing packages or pushing templates. Chefspec uses Fauxhai to mock Ohai data, and thus the unit tests don't need to be run on the same operating system as your dev or production servers.

Unit Tests

I write my unit tests in Chefspec (the other tools mostly take care of themselves and don't require much care and feeding). Chefspec is an extension of the rspec framework and tests written in the spec/ directory of your cookbook and are named by convention: <recipe-name>_spec.rb. In my Rails application example we would have the file spec/application_spec.rb. There is also a spec/spec_helper.rb which calls the chefspec modules and sets any common settings or Ohai (chefspec uses Fauxhai to fake it) data.

The basic workflow of Chefspec is that you describe what you're testing in a describe block which includes the call to run the fake chef run and sets any options or node attributes to be set before running any tests inside the block. Tests are written as it blocks and are simply pseudocode explaining what the function you're testing should do followed by the result that you expect to see from a successful run of that function. The testable resources are very well documented.

I know that my application recipe will need to include some recipes, create a user, and clone a git repository, so I will write the following tests:

spec/application_spec.rb


require_relative 'spec_helper'

describe 'ircaas::application' do 
 before do
   @chef_run = ::ChefSpec::Runner.new ::UBUNTU_OPTS do |node|
     node.set['ircaas'] = { # Sets custom node attributes
       user: 'ircaas', # so that we don't fail just because somebody went in
       path: '/opt/ircaas', # and changed a value in the default attributes file.
       git: { repo: 'ssh://git.path', branch: 'master' }
     }
   end
   @chef_run.converge 'ircaas::application' # Fake converges recipe.
 end

 it 'includes ruby::default recipe' do
   expect(@chef_run).to include_recipe 'ruby::default'
 end

 it 'includes git::default recipe' do
   expect(@chef_run).to include_recipe 'git::default'
 end

 it 'creates ircaas user' do
   expect(@chef_run).to create_user('ircaas')
 end

 it 'checkouts ircaas from repo' do
   expect(@chef_run).to checkout_git("/opt/ircaas").with(repository: 'ssh://git.path', branch: 'master')
 end

# a test without an expect will be marked as pending, useful
# if you don't know how to test a specific function, or you
# want to write the test later.
 it 'an example to help show pending tests' do
   pending 'I don't know how to test this function yet'
 end

end
After writing the tests I will go ahead and write the recipe to pass them.

recipe/application.rb


# Cookbook Name:: ircaas
# Recipe:: application

include_recipe 'ruby::default'
include_recipe 'git::default'

user node['ircaas']['user'] do
 username node['ircaas']['user']
 comment "ircaas User"
 shell "/bin/bash"
 home "/home/ircaas"
 system true
end

git node['ircaas']['path'] do
 repository node['ircaas']['git']['repo']
 branch node['ircaas']['git']['branch']
 destination node['ircaas']['path']
 action :checkout
end
Finally I run berkshelf to fetch any required cookbooks and then run strainer to run through the tests.

bundle exec berks install
bundle exec strainer test

Integration Test

Of course units tests are only part of the picture and I want to make sure that the whole cookbook functions correctly and will result in a node configured and working as defined in your cookbook. To perform an Integration Test I use Vagrant, for which I have a base Vagrantfile in my meez repo. I won't bore you with too much detail because chances are you're already familiar with Vagrant. Needless to say I run vagrant up and then after it completes provisioning I SSH into it and test that the node has converged and my rails application is running.

Summary

We've explored the basics of doing README/Test Driven Development for Chef Cookbooks. This has been a very shallow look at a very deep topic so I encourage you to look around at other tools and frameworks and try to find something that works for you. It took me quite some time to really grok the whole process and longer again to be able to proudly declare that I'm somewhat competent at it.

If at first chefspec is really hard just write pending tests for everything, or skip it altogether. The rest of the tests provided by Strainer will still help catch issues without having to wait for a node to converge.

One of the unexpected advantages I've found when following this framework is that there are two places I really have to think about what I want to acheive before I even write a single line of a recipe (in the README and writing the tests). This gives me time to really formulate in my head what it is I need to do and have already started breaking it down into small easy chunks that can be written between coffee breaks when it comes time to actually write code.

Further reading

December 10, 2013

Day 10 - AWS Spot Instances - HowTo and Tweaks

Written By: Jesse Davis (@jessemdavis)
Edited By: Shaun Mouton (@sdmouton)

At AppNeta, we provide software instrumentation, open source libraries and network hardware to instrument your network and software to provide information to you about your Full Stack™. On the software side, we do this by emitting tracing information back to our application, where we process, analyze and consolidate it to provide you with precise information about the health of your stack. We're a big fan of AWS, and have used spot pricing and AutoScaling groups to make our trace processing pool efficient and, more importantly, inexpensive to run.

Problems We've Encountered

However, auto-scaling groups are not a panacea to alleviating scaling concerns. Spot instances can be in heavy demand during certain periods, and bidding for them can be fierce, to say the least. One strategy that we have seen other users of spot instances employ is heavily over-bidding on spot instances. For example, we've seen spot prices for m3.2xlarge instances go as high as $7.00 for a four-day period. The normal on-demand price for these instance types is $1.00. Although this can ensure spot instance requests can be fulfilled, it's economically infeasible, to say the least.

Depending on how your autoscaling group is configured as well, being blocked from fulfilling spot instance requests can cause other problems. We recently modified our autoscaling groups to split across three availability zones (AZ). However, we noticed that in one AZ, the spot price had jumped well above our request spot price. Since autoscaling groups, by default, attempt to balance the instances evenly across the zones you have defined, this resulted in the autoscaling group terminating instances in one of the other AZs as well. This effectively decreased our processing capability to a third of its normal capacity. While this was technically enough capacity to handle our trace stream without problems, we would now have to manually manage our instance counts to handle possible incoming spikes.

Our solution

We knew that we wanted to keep a minimum number of instances up regardless of the availability of spot instances. However, we obviously want to favor using spot instances for the cost factor. So, our implementation follows one basic rule: if a spot instance terminates, bring up a on-demand instance to cover it. We do this with a combination of SNS, SQS and boto.

We define a SQS queue and SNS topic to provide the bridge to provide the bridge between our autoscaling group and the daemon that will monitor it.
ubuntu@host $ aws --region=us-east-1 sqs create-queue --queue-name spot-scale-demand
{
    "QueueUrl": "https://queue.amazonaws.com/1111111111/spot-scale-demand"
}
SNS_TOPIC='spot-autoscale-notifications'
SQS_QUEUE='spot-autoscale-notifications'

SNS_ARN=$(sns-create-topic $SNS_TOPIC)
SQS_ARN="arn:aws:sqs:us-east-1:1111111111:${SQS_QUEUE}"
sns-add-permission $SNS_ARN --label "ETLDemandBackupGroup" --action-name Publish,Subscribe,Receive --aws-account-id 11111111111 
sns-subscribe $SNS_ARN --protocol sqs --endpoint "$SQS_ARN"
We set up our autoscaling groups. We start off with having the demand group be empty, since we want to favor having our processing done on spot instances.
as-create-launch-config spot-lc --image-id ami-12345678 --instance-type m3.2xlarge \
    --group etl --key appneta --user-data-file=prod_data.txt \
    --spot-price 1.00
as-create-launch-config demand-lc --image-id ami-12345678 --instance-type m3.2xlarge \
    --group etl --key appneta --user-data-file=prod_data.txt
as-create-auto-scaling-group spot-etl-20131116 --launch-configuration spot-lc \
    --availability-zones us-east-1a,us-east-1b --default-cooldown 600 --min-size 1 --max-size 3
as-create-auto-scaling-group demand-etl-20131116 --launch-configuration demand-lc \
    --availability-zones us-east-1a,us-east-1b --default-cooldown 600 --min-size 0 --max-size 3
I'm leaving off scaling policies and metric alarms, since they'll be specific to your processing and workload.

We define notification configurations for each autoscaling group, and tell the autoscaling group to send a message to the SNS topic we defined whenever an instance is launched or terminated in the group. We also have another notification configuration for sending an email to our operations team when these scaling actions happen so that we have a secondary history.
for group in spot-etl-20131116 demand-etl-20131116; do
    for notification in spot-autoscale-notifications ops-alerts-email ; do
        as-put-notification-configuration $group -t "arn:aws:sns:us-east-1:111111111:${notification}" \
            -n autoscaling:EC2_INSTANCE_LAUNCH, autoscaling:EC2_INSTANCE_TERMINATE
    done
done
For the last part of our setup, let's be nice to our operations team and turn on Cloudwatch metrics on the autoscaling groups.
for group in spot-etl-20131116 demand-etl-20131116; do
    as-enable-metrics-collection $group -g 1Minute \
        -m GroupMinSize,GroupMaxSize,GroupPendingInstances,GroupInServiceInstances,GroupTotalInstances,GroupTerminatingInstances,GroupDesiredCapacity
done
Now we'll look into a overview of the daemon itself. We're primarily a Python shop, and rely heavily on the great boto library for most of our AWS interaction, just like Amazon. Our basic program flow looks like:
while (true):
  read message from SQS queue
  if it's a TERMINATE message and from a spot group:
    find the corresponding demand group
    adjust the demand group instance count by 1
I won't go into how to set up your environment with the correct keys to allow boto access to your AWS account. Even better, create an IAM role and assign it to the instance you run the daemon on.

Let's read the message off the queue:
MAX_RETRIES = 5

def update_groups_from_queue(queue=None):
    """ Connect to SQS and update config based on notifications """
    env = os.environ
    if ('AWS_ACCESS_KEY_ID' not in env or 'AWS_SECRET_ACCESS_KEY' not in env):
        raise Exception("Environment must have AWS_ACCESS_KEY_ID and AWS_SECRET_ACCESS_KEY set.")
    _process_queue(queue)

def _process_queue(queue):
    retries = 0
    delay = 5

    sqs = boto.connect_sqs()
    q = sqs.create_queue(queue)
    q.set_message_class(RawMessage)

    while True:
        try:
            rs = q.get_messages()
            for msg in rs:
                if _process_message(msg):
                    q.delete_message(msg)

            time.sleep(10)
            # if we make it here, we're processing correctly, we want to watch for consecutive
            # errors
            retries = 0
            delay = 5
        except SQSError as sqse:
            retries += 1
            log.info("Error in SQS, attempting to retry: retries: %d, exception: %r" % (retries, sqse))
            if retries >= MAX_RETRIES:
                log.error("Maximum SQS retries hit, giving up.")
                raise sqse
            else:
                time.sleep(delay)
                delay *= 1.2    # exponential backoff, similar to tracelon's @retry
There's nothing overly complicated here; it's just your basic processing loop. We pass in the queue name (in our case, spot-scale-demand) from the command line using argparse and feed the name to update_groups_from_queue. We process the message and sleep for 10 seconds. We only delete the message if we successfully processed it, so we can investigate broken messages after the fact. If we encounter an error reading from the queue, we sleep with an exponential backoff, and try again, up to 5 times. Past that, we assume that our SQS endpoint is having problems, and it'll be likely we're up and monitoring things :)

Now we process the message to determine if we need to scale up our demand instances.
def _process_message(msg):
    """ Process the SQS message. """
    try:
        m = json.loads(msg.get_body())
    except ValueError:
        # Unexpected message (non-json). Throw it away.
        log.error("Could not decode: %s" % (msg.get_body()))
        return True

    # There are 2 different message types in this queue: AWS generated (a result of autoscale activities)
    # and ones we send explicitly.

    msg_type = m['Type']
    if msg_type == 'Notification':
        # From AWS autoscale:
        payload = json.loads(m['Message'])
        spot_group = payload.get('AutoScalingGroupName', '')
        cause = payload.get('Cause', '')

        if not _is_spot_group(spot_group):
            log.info("Received AWS notification for non-spot group %s, ignoring." % spot_group)
            return True

        # usually we'll want to look for 'was taken out of service in response to a system health-check.'
        # if user initiated, will be 'user health-check', which can be triggered via
        # as-set-instance-health i-______ --status Unhealthy.
        # We could ignore this, but it makes testing much easier.
        if not re.search(r'was taken out of service in response to a (system|user) health-check.', cause):
            log.info("Received AWS notification for spot group %s, but not due to health check termination, ignoring." % spot_group)
            return True

        if event == 'autoscaling:EC2_INSTANCE_TERMINATE':
            _adjust_demand_group(spot_group, 1)
        else:
            log.info("Ignoring notification: %s", payload)
We grab the message body and load into a JSON object. The main attributes we care about are:
  • the notification type
  • the name of the autoscaling group
  • the cause of the autoscaling event
We ignore the request if the event came from a group that's not a spot group (more on this next), and also ignore the event unless it's a health check event. This allows up to manually adjust the capacity of the spot group without firing off launch commands to the demand autoscaling group. Last, don't do anything unless the event was from an instance termination.

Now we can implement the logic of when to spin up a demand instance. Now, please don't laugh, because we have some very simple logic right now :)
def _is_spot_group(group_name):
    """" Returns true if the group's name refers to a spot group. """
    # pretty simple, all our spot groups will have spot in the name
    return '-spot-' in group_name
Yes, that's how we mark our autoscaling groups as spot groups. Pretty simple, huh?

We want to make sure that we only spin up instances in the demand group that corresponds to our spot group.
def _find_demand_scaling_group(spot_group):
    """ Find the corresponding on-demand group for the given spot group.
        For now, just rely on them being named similarly.
        Returns the boto autoscale group object, or None if no group found. """
    autoscale = boto.connect_autoscale()
    as_groups = autoscale.get_all_groups()

    demand_group = re.sub(r'spot-', r'', spot_group)
    demand_group = re.sub(r'-\d+$', r'', demand_group)
    log.debug("Given spot group %s, find demand group similar to %s" % (spot_group, demand_group))

    result = [ group for group in as_groups
               if demand_group in group.name and not _is_spot_group(group.name) ]
    return sorted(result, key=lambda group: group.name).pop() if result else None
Basically, we name the groups the same, append 'spot-' on the spot autoscaling group, and append the date when we deploy the groups to the names of both. This could be anything you want, like serial numbers, build numbers, and version numbers (similar to how Netflix defines their groups in Asgard).

Finally, we adjust the capacity of the demand autoscaling group.
def _adjust_group(group, adjustment):
    """ Change the number of instances in the given boto group by the given amount. """
    try:
        current_capacity = group.desired_capacity
        desired_capacity = current_capacity + adjustment
        if desired_capacity < group.min_size or desired_capacity > group.max_size:
            log.info("Demand group count already at bound, adjust via AWS if necessary.")
            return
        group.desired_capacity = desired_capacity
        group.min_size = desired_capacity
        group.update()
        log.info("Adjusted instance count of ASG %s from %d to %d." %
                 (group.name, current_capacity, desired_capacity))
    except Exception as e:
        log.exception(e)

def _adjust_demand_group(spot_group, adjustment):
    """ Change the number of instances in on-demand ASG paired with the given spot group name
        by the given amount. """

    try:
        demand_group = _find_demand_scaling_group(spot_group)
        if demand_group:
            _adjust_group(demand_group, adjustment)
        else:
            log.error("No demand group found similar to %s." % spot_group)
    except Exception as e:
        log.exception(e)
Again, there's nothing very complicated here. We don't attempt to set the capacity of the demand group below its minimum or maximum.

And that's it! Throw all this in a python script and run it. We're big fans of supervisor here, so we set up a supervisor configuration for our script to ensure the daemon stays up.

Improvements


So far, this daemon is working out pretty well for us, but we still plan on improving it.

  • We're researching now moving to an autoscaling group per availability zone for our processing nodes to allow even more fine-grained control over how many instances are in each zone, instead of being at the mercy of having the same count in each AZ as it stands now.
  • The main logic of our algorithm is definitely very simple right now. The astute reader will notice that we never decrease the number of instances in our demand group. This is good for ensuring that our processing pool never loses a lot of capacity, but it also means our operations team eventually has to adjust the demand group back down to acceptable levels. My next steps will definitely involve checking the current spot instance requests and scaling the demand group back down once the requests have been fulfilled and the spot group instance count is stable.

December 9, 2010

Day 9 - Automated Deployments with LittleChef

Written by Grig Gheorghiu (@griggheo)

Prologue

Sysadmin #1 (to Sysadmin #2): So...I need you to tell me....what is Devops?

Syadmin #2: Devops? I don't know....I didn't expect a kind of Devops Inquisition!

[JARRING CHORD]

[The door flies open and Senior Devops admin Ximinez of Spain enters, flanked by two junior Devops admins]

Ximinez: NOBODY expects the Devops Inquisition! Our chief weapon is collaboration...collaboration and automated deployments... Our two weapons are collaboration and automated deployments...and ruthless procrastination.... Our three weapons are collaboration, automated deployments, and ruthless procrastination...and an almost fanatical devotion to vi.... Our four...no... Amongst our weapons.... Amongst our weaponry...are such elements as collaboration, automated deployments.... I'll come in again.

Automated deployment systems: push vs. pull

I don't need the Devops Inquisition to tell me that I need to use automated deployment/configuration management systems. They are indeed a critical part of a self-respecting sysadmin's weaponry. Without them, the activities of deploying and configuring servers become haphazard and fraught with errors.

I like to differentiate between two types of automated deployment tools. One type is what can be called a `push' system: a centralized server 'pushes' deployments by running commands via ssh on remote nodes. Examples of push systems are Fabric and Capistrano. The other type is what can be called 'pull' systems: remote nodes 'pull' commands and configurations from a centralized 'master' server. Examples of pull systems are Chef and Puppet.

To me, the main advantage of a push system is that you're under total control of what gets deployed where and at what time. Its main disadvantage is that it doesn't scale well when you have to control hundreds of servers, although you could use parallel ssh tools to help you there. In contrast, a pull system is inherently more scalable, because the nodes contact the 'master' asynchronously and independent of each other (see this blog post of mine for more details and comments on this topic.) However, with a pull system you can lose some of the control on the exact targets and timing of the deployments.

My personal philosophy on using push vs. pull systems is to use a pull system when a node boots up (as an EC2 instance for example, or bootstrapped with cobbler as another example) and have the node create required users, mount file systems, install monitoring tools, install and configure pre-requisite packages -- basically everything up to the level of the actual application. I prefer to then use a 'push' system to actually deploy the application and its configuration files. Why? Because I usually do it in small batches of servers at a time, and I would be nervous to know that a bad configuration change can propagate to all nodes if I were to deploy it via a 'pull' system. Note however that I manage tens and not hundreds of servers, so in this latter case I would definitely at least reconsider my options. Introducing LittleChef

One drawback of 'pull' systems is their complexity. You usually need to configure the 'master' server, then have nodes authenticate against it and ask it for tasks to run. If you've ever configured Chef Server for example, you know it's not exactly trivial. This is one reason why Chef provides a variant called Chef Solo which runs in isolation on a given node without requiring communication with a master server. The nice thing about Chef Solo is that it still uses all the other concepts of Chef (and Puppet for that matter): cookbooks, recipes, attributes, roles, etc.

The question becomes: how do you get Chef Solo installed on a node? Well, one way of doing it is by using LittleChef, a package created by Miquel Torres, who is also the author of Overmind. LittleChef is written in Python and uses Fabric as the underlying mechanism of getting Chef Solo installed on a remote node, then sending cookbooks and roles to that node for further processing via Chef Solo. It's a bit ironic that a Python-based package deals with configuring and running a Ruby-based tool such as Chef Solo, but it also shows flexibility in the design of Chef, since many of the configuration files inspected by Chef are in JSON format, easy to interpret in any modern language.

Essentially, LittleChef is a push system, so it brings simplicity to the table. The fact that deployments are done on the remote nodes via Chef Solo also brings into play the full repertory of a solid configuration management tool. It should be relatively easy to migrate the remote nodes from Chef Solo to a full-blown Chef Client / Chef Server setup down the road.

Another nice thing about LittleChef is that it allows you to easily debug your cookbooks and roles. In a typical Chef Client/Server setup, once you modify a cookbook or a role, you need to upload to the Chef Server via the knife utility, then wait for the Chef Client on the remote node to contact the server, then inspect the Chef log file for any errors. With LittleChef, the process is much simpler: you modify a cookbook and/or a role, then you push it to the remote node and you see any errors in real time. Read on for details on how exactly you do this.

Working with LittleChef

Here I am using Ubuntu Lucid 10.04 as my OS. A similar procedure can be followed for RedHat-based systems.

First install some pre-requisites:

# apt-get install build-essential python-dev python-pip python-setuptools git-core

Then install Fabric and LittleChef via pip (or you can use easy_install if you prefer):

# pip install fabric
(this also installs pycrypto and paramiko)

# pip install littlechef
(this will install the latest version of LittleChef at the time of this
writing, which is 0.4.0)

Initial LittleChef Configuration

Create a directory where your cookbooks, roles and node information will be located. I like to call this directory 'kitchen', as Miquel suggests in his documentation:

$ mkdir kitchen; cd kitchen

Now run the main LittleChef utility script, appropriately named 'cook', with new_deployment as an argument. It will create some sub-directories and a file called auth.cfg:

$ cook new_deployment
nodes/ directory created...
cookbooks/ directory created...
roles/ directory created...
auth.cfg created...

Edit auth.cfg and specify an user name and a password used for ssh-ing to the remote nodes (make sure this user has sudo access on the remote node.)

If you want to use some of the cookbooks already published by Opscode, you can replace the cookbooks directory with a git clone of the Opsode cookbook repository from GitHub:

$ rm -rf cookbooks
$ git clone https://github.com/opscode/cookbooks.git

Installing Chef Solo on the remote node

In the following examples, I'll use a server named app1 as my target remote node. All the 'cook' commands in these examples have 'kitchen' as the current working directory. If you try to run the 'cook' command outside of the 'kitchen', you'll get an error message:

Fatal error: You are executing 'cook' outside of a deployment directory To create a new deployment in the current directory type 'cook new_deployment'

The first step in actually doing deployments via LittleChef is to install Chef Solo on the remote node. This is very easy with the 'cook' command again, this time with the 'deploy_chef' argument:

$ cook node:app1 deploy_chef

The LittleChef documentation talks about other ways of installing Chef Solo on the remote node, for example via gems, or without asking for a confirmation. See the README for more details.

Deploying an Opscode cookbook on the remote node

As a first example, let's deploy memcached on the remote node. There already is a cookbook for memcached in the Opscode repository. If you ran the git clone command above, you're all set to go. Assuming you are OK with the default values for memcached (which are set in the file kitchen/cookbooks/memcached/attributes/default.rb), all you need to do is run:

$ cook node:app1 recipe:memcached

== Executing recipe memcached on node app1 ==
Uploading cookbooks... (memcached, runit)
Uploading roles...
Uploading node.json...

== Cooking... ==

[app1] out: [Tue, 07 Dec 2010 11:14:21 -0800] INFO: Setting the run_list to
["recipe[memcached]"] from JSON
[app1] out: [Tue, 07 Dec 2010 11:14:21 -0800] INFO: Starting Chef Run (Version
0.9.8)
[app1] out: [Tue, 07 Dec 2010 11:14:22 -0800] INFO: Upgrading
package[memcached] version from uninstalled to 1.4.2-1ubuntu3
[app1] out: [Tue, 07 Dec 2010 11:14:27 -0800] INFO: Upgrading
package[libmemcache-dev] version from uninstalled to 1.4.0.rc2-1
[app1] out: [Tue, 07 Dec 2010 11:14:30 -0800] INFO: Writing updated content for
template[/etc/memcached.conf] to /etc/memcached.conf
[app1] out: [Tue, 07 Dec 2010 11:14:30 -0800] INFO: Backing up
template[/etc/memcached.conf] to
/var/chef/backup/etc/memcached.conf.chef-20101207111430
[app1] out: [Tue, 07 Dec 2010 11:14:30 -0800] INFO:
template[/etc/memcached.conf] sending restart action to service[memcached]
(immediate)
[app1] out: [Tue, 07 Dec 2010 11:14:31 -0800] INFO: service[memcached]:
restarted successfully
[app1] out: [Tue, 07 Dec 2010 11:14:31 -0800] INFO: Chef Run complete in
9.569211 seconds
[app1] out: [Tue, 07 Dec 2010 11:14:31 -0800] INFO: Running report handlers
[app1] out: [Tue, 07 Dec 2010 11:14:31 -0800] INFO: Report handlers complete

SUCCESS: Node correctly configured

Done.
Disconnecting from app1... done.

The cook command above will also create a file called app1.json in the kitchen/nodes directory. Here is the file:

$ cat nodes/app1.json
{
   "run_list": [
       "recipe[memcached]"
   ]
}

Now assume you want to override some of the default memcached attributes. Let's say you want to use more 1 GB of RAM for memcached rather than the default 64 MB. You can just edit app1.json and add this stanza to override that attribute:

 "memcached": {
   "memory": "1024"
 }

(if you add it at the end of the JSON file, make sure you put a comma after the previous “run_list” stanza, otherwise the JSON syntax is invalid; however, even if you have an invalid JSON syntax, the cook command will let you know exactly what the syntax error is, which is a nice touch)

Now run the cook command, this time telling it to just configure the node. This will use whatever you specified in app1.json, so there is no need to specify the recipe name again on the command line:

$ cook node:app1 configure

== Configuring app1 ==
Uploading cookbooks... (memcached, runit)
Uploading roles...
Uploading node.json...

== Cooking... ==

[app1] out: [Tue, 07 Dec 2010 11:45:36 -0800] INFO: Setting the run_list to
["recipe[memcached]"] from JSON
[app1] out: [Tue, 07 Dec 2010 11:45:36 -0800] INFO: Starting Chef Run (Version
0.9.8)
[app1] out: [Tue, 07 Dec 2010 11:45:37 -0800] INFO: Writing updated content for
template[/etc/memcached.conf] to /etc/memcached.conf
[app1] out: [Tue, 07 Dec 2010 11:45:37 -0800] INFO: Backing up
template[/etc/memcached.conf] to
/var/chef/backup/etc/memcached.conf.chef-20101207114537
[app1] out: [Tue, 07 Dec 2010 11:45:37 -0800] INFO:
template[/etc/memcached.conf] sending restart action to service[memcached]
(immediate)
[app1] out: [Tue, 07 Dec 2010 11:45:38 -0800] INFO: service[memcached]:
restarted successfully
[app1] out: [Tue, 07 Dec 2010 11:45:38 -0800] INFO: Chef Run complete in
1.757141 seconds
[app1] out: [Tue, 07 Dec 2010 11:45:38 -0800] INFO: Running report handlers
[app1] out: [Tue, 07 Dec 2010 11:45:38 -0800] INFO: Report handlers complete

SUCCESS: Node correctly configured

Done.
Disconnecting from app1... done.

At this point, the /etc/memcached.conf file on node app1 will contain the new memory value 1024.

Adding your own cookbooks and recipes

I won't go into much detail on what exactly you need to do in order to create your own cookbook. It's a good idea to start from an existing one, and add your own recipes. Assuming your company is ACME Corporation, it's a good idea to create a cookbook called 'acme', so I will use that in my examples below.

First off, LittleChef expects the cookbook metadata file to be in JSON format. Here's an example:

$ cat cookbooks/acme/metadata.json 
{
   "suggestions": {
   },
   "maintainer_email": "admin@acme.com",
   "description": "Installs required packages for ACME applications",
   "recipes": {
     "acme": "Installs required packages for ACME applications"
   },
   "conflicting": {
   },
   "attributes": {
   },
   "providing": {
   },
   "dependencies": {
     "screen": [
     ],
     "python": [
     ],
     "git": [
     ],
     "build-essential": [
     ],
     "ntp": [
     ]
   },
   "replacing": {
   },
   "platforms": {
     "debian": [
     ],
     "centos": [
     ],
     "fedora": [
     ],
     "ubuntu": [
     ],
     "redhat": [
     ]
   },
   "version": "0.1.0",
   "groupings": {
   },
   "license": "Apache 2.0",
   "long_description": "",
   "name": "acme",
   "recommendations": {
   },
   "maintainer": "ACME"
 }

Note that the metadata file above specifies that the acme cookbook has dependencies on some other cookbooks: screen, python, git, build-essential and ntp. These are all part of the Opscode cookbook repository. LittleChef will figure out these dependencies and will transfer the main cookbook (acme) along with all the cookbooks it depends on to the remote node, so they can be processed by Chef Solo.

Here's an example of a recipe I use, located in cookbooks/acme/recipes/nginx.rb:

$ cat cookbooks/acme/recipes/nginx.rb
# install nginx from source
nginx = "nginx-#{node[:acme][:nginx_version]}"
nginx_pkg = "#{nginx}.tar.gz"
nginx_upstream = "nginx-upstream-fair.tar.gz"

downloads = [
   "#{nginx_pkg}",
   "#{nginx_upstream}",
]

downloads.each do |file|
   remote_file "/tmp/#{file}" do
       source "http://#{node[:acme][:web_server]}/download/nginx/#{file}"
   end
end

script "install_nginx_from_src" do
 interpreter "bash"
 user "root"
 cwd "/tmp"
 not_if "test -f /usr/local/nginx/conf/nginx.conf"
 code <<-EOH
   tar xvfz #{nginx_upstream} 
   cd /tmp
   tar xvfz #{nginx_pkg}; cd #{nginx}; ./configure --with-http_ssl_module
   --with-http_stub_status_module --add-module=/tmp/nginx-upstream-fair/; make;
   make install 
   EOH
end

This recipe downloads an nginx tarball and installs it via make install. Note that the recipe uses two attributes, referenced as node[:acme][:nginx_version] and node[:acme][:web_server]. These attributes have default values set in cookbooks/acme/attributes/default.rb:

default[:acme][:web_server] = 'mywebserver.acme.com'
default[:acme][:nginx_version] = '0.8.20'

I find it a good practice to use an attribute wherever I am tempted to use a hardcoded value for a variable in my recipes. This makes it easy to override the attribute at the node level or at the role level.

My 'acme' cookbook also has a recipe called default.rb, where I do things such as installing more pre-requisite Python packages, adding more users, etc.

Configuring roles

Instead of configuring nodes based on individual recipes (like we did when we configured node app1 with the memcached recipe), a better way is to define roles that nodes can belong to. Roles are in my view the most critical concept of any good deployment/configuration management system. In Chef, roles are the glue that ties nodes to cookbooks and recipes. A given node can belong to multiple roles. If you change any recipe that a given role includes, all nodes belonging to that role will automatically get the updated recipe.

Let's define a role called 'appserver'. This is done via a JSON file located in kitchen/roles:

$ cat roles/appserver.json 
{
   "name": "appserver",
   "json_class": "Chef::Role",
   "run_list": [
     "recipe[acme]",
     "recipe[acme::nginx]",
     "recipe[memcached]"
   ],
   "description": "Installs required packages and applications for an ACME app
   server",
   "chef_type": "role",
   "default_attributes": {
     "memcached": {
       "memory": "1024"
     }
   },
   "override_attributes": {
   }
 }

Several things to note in this role definition:

  • the run_list stanza specifies the recipes that need to be executed by nodes belonging to this role (the order of the recipes is also preserved, which is nice); in this example, the recipe defined in default.rb in the acme cookbook will be executed, followed by the recipe defined in nginx.rb in the acme cookbook, followed by the recipe defined in default.rb in the memcached cookbook
  • because the acme cookbook depends on other cookbooks listed in its metadata file (screen, python, git, build-essential and ntp), the default recipes in those cookbooks will be executed before the default acme cookbooks recipe gets executed
  • we use the default_attributes stanza to override the memcached memory from the default value of 64 MB (set as we mentioned before in cookbooks/memcached/attributes/default.rb) to a value of 1024 MB; I refer the reader to the "Attribute Type and Precedence" wiki page from the Opscode documentation for more details on how attributes can be set and overridden at various levels

Now we have to associate the node app1 with the role appserver. We can just modify the file nodes/app1.json like this:

$ cat nodes/app1.json
{
   "run_list": [
       "role[appserver]"
   ]
}

Finally, we can run the cook command and configure the node with its new role:

  $ cook node:app1 configure

  == Configuring app1 ==
  Uploading cookbooks... (acme, memcached, python, build-essential, screen, git,
  ntp, runit)
  Uploading roles...
  Uploading node.json...

  == Cooking... ==

  […... etc (more output here) ]

Note how littlechef figured out all the dependencies and uploaded the respective cookbooks to the remote node.

Querying for nodes, roles and recipes

A nice feature of LittleChef is that is allows you to query its inventory (defined by the information contained in the cookbooks, roles and nodes sub-directories of the 'kitchen' directory) for things such as 'nodes pertaining to a given role' or 'nodes that apply a given recipe', or 'list of all roles' or 'list of all recipes'. You can run 'cook -l' to see the available command-line options:

$ cook -l
LittleChef: Configuration Management using Chef without a Chef Server

Available commands:

   configure               Configure node using existing config file
   debug                   Sets logging level to debug
   deploy_chef             Install Chef-solo on a node
   list_nodes              List all nodes
   list_nodes_with_recipe  Show all nodes which have asigned a given recipe
   list_nodes_with_role    Show all nodes which have asigned a given recipe
   list_recipes            Show all available recipes
   list_roles              Show all roles
   new_deployment          Create LittleChef directory structure (Kitchen)
   node                    Select a node
   recipe                  Execute the given recipe,ignores existing config
   role                    Execute the given role, ignores existing config

Here is an example of querying for all nodes pertaining to the 'appserver' role:

$ cook list_nodes_with_role:appserver

app1 Role: appserver default_attributes: memcached: {'memory': '1024'} override_attributes: Node attributes:

Epilogue

Ximinez [with a cruel leer]: Now -- you will stay in the Comfy Aeron Chair until lunch time, with only a cup of coffee at eleven. [aside, to Biggles] Is that really all it is?

Biggles: Yes, lord.

Ximinez: I see. I suppose we make it worse by shouting a lot, do we? Confess, Sysadmin. Confess! Confess! Confess! Confess!

Biggles: I confess!

Ximinez: Not you!

So, Sysadmin, if you don't have an automated deployment/configuration management strategy yet, and if you want to avoid torture in the Comfy Aeron Chair, then roll up your sleeves and roll out a deployment system like LittleChef for your infrastructure TODAY!

Further reading

  1. Opscode Chef wiki
  2. Some blog posts of mine on "Chef Installation and Minimal Configuration", "Working with Chef Cookbooks and Roles", "Bootstrapping EC2 Instances with Chef", "Working with Chef Attributes"
  3. A four-part blog post series on “Building a Django App Server with Chef” by Eric Holscher (Part 1, Part 2, Part 3, Part 4)
  4. Collaboration, ruthless procrastination and an almost fanatical devotion to vi are exercises left to the reader

December 24, 2009

Day 24 - Config Management with Cfengine 3

This article was written by Aleksey Tsalolikhin. If you are already using another automation tool, and even have no plans to change, this article may help you understand where much of today's config management and automation concepts came from.

Cfengine3 marks the third major version of the original configuration management software that started 16 years ago. Like Puppet, Chef, Bcfg2, and others, Cfengine helps you automate the configuration and maintenance of your systems.

I chose cfengine because of it's long track record, large user base, academic origins, wide platform support, and supportive community.

For the uninitiated, configuration management tools help you maintain a desired configuration state. If the system is not in the correct state, the config management tool will perform actions to move into the correct state. For example, if your state includes a cron job, and one of the systems doesn't have that cron job, the config management tool will install it. No action would be taken if the cron job already existed correctly.

Cfengine has its own configuration language. This language allows you to describe how things should be (state) and when necessary, describe how to do it or what to do. Using this language you create configuration "policy rules" or "promises" of how the system should be configured. Cfengine manages how to get to the promised state automatically.

In this way, Cfengine becomes your automated systems administrator, a kind of robot that maintains your system by your definitions. As exampled above: if a cron job is missing, and you said you wanted it, Cfengine will add it.

Your job then is promoted to one of configuring this automated system and monitoring its function. You can configure it to add cron jobs, upgrade software packages, or remove users, on thousands of hosts as easily as on one host. Use this tool with care ;)

Cfengine can be used standalone or in a client-server model. In the latter, if the server is unreachable, the client is smart and uses the last-seen cached set of policies and uses those until it can reach the server again. In either model, the client-side performs the checks and maintenance actions, so this should scale to thousands of hosts.

Speaking of using Cfengine, the language syntax in the latest version (3) has been cleaned up from the previous version, which had grown to be varied and inconsistent.

When using Cfengine, it's important to know some terms:

Promise
A promise is a Cfengine policy statement - for example, that /etc/shadow is only readable by root - and it implies Cfengine will endeavor to keep that promise.
Pattern
I asked Mark to clarify for us what he means by "patterns" in Cfengine 3. Here is his answer:
A "configuration" is a design arrangement or a pattern you make with system resources. The cfengine language makes it easy to describe and implement patterns using tools like lists, bundles and regular expressions. While promises are things that are kept, the efficiencies of configuration come from how the promises form simple re-usable patterns.
Class
For you programmers, this has nothing to do with the Object-Oriented term. Classes are "if/then" tests but the test itself is hidden "under the hood" of Cfengine. There is no way to say "if/then" in Cfengine except with classes. Example - this shell script will only be executed on Linux systems:
shellcommands:
    linux:: "/var/cfengine/inputs/sh/my_script.sh"
There are a number of built-in classes, like the linux class above; they can also be explicitly defined.
Bundle
A bundle is a collection of promises
Body
The body of a promise explains what it is about. Think of the body of a contract, or the body of a document. Cfengine "body" declarations divide up these details into standardized, paramaterizable, library units. Like functions in programming, promise bodies are reusable and parameterized.
  cfengine-word => user-data-pattern

  body cfengine-word user-data-pattern
  {
      details
  }
The basic grammar of Cfengine 3 looks like this:
  promisetype:
      classes::
          "promiser" -> { "promisee1", "promisee2", ... }
              attribute_1 => value_1,
              attribute_2 => value_2,
              ...
              attribute_n => value_n;
Classes are optional. Here is the list of promise types:
  • commands - Run external commands
  • files - Handle files (permissions, copying, etc.)
  • edit_line - Handle files (content)
  • interfaces - Network configuration
  • methods - Methods are compound promises that refer to whole bundles of promises.
  • packages - Package management
  • processes - Process management
  • storage - Disk and filesystem management
Here's another example:
    files:
       "/tmp/test_plain" -> "John Smith",
            comment => "Make sure John's /tmp/test_plain exists",
            create  => "true";
Above, we have the promisee on the right side of the arrow. The promisee is "the abstract object to whom the promise is made". This is for documenation. The commercial version of cfengine uses promisees to generate automated knowledge maps. The object can be the handle of another promise with an interest in the outcome or an affected person who you might want to contact in case of emergency.

How about a more complete and practical example? Lets ensure some ntp and portmap services are running:

body common control
{
  # We can give this a version
  version => "1.0";
  # specify what bundles to apply
  bundlesequence  => { "check_service_running"  };
}

bundle agent check_service_running
{
    vars:
        # name    type  =>    value
        "service" slist => {"ntp", "portmap"};
        "daemon_path" string => "/etc/init.d";

    processes:
        "$(service)"
            comment => "Check processes running for '$(service)'",
            restart_class => "restart_$(service)";

    commands:
        "${daemon_path}/${service} start"
            comment => "Execute the start command for the service",
            ifvarclass => "restart_${service}";
}
Saving this as 'servicecheck.cf' we can test it in standalone mode with cf-agent:
% sudo /etc/init.d/portmap status
 * portmap is not running
% sudo /etc/init.d/ntp status    
 * NTP server is not running.

% sudo cf-agent -f ./servicecheck.cf
Q: "...init.d/ntp star":  * Starting NTP server ntpd
Q: "...init.d/ntp star":    ...done.
I: Last 2 QUOTEed lines were generated by promiser "/etc/init.d/ntp start"
I: Made in version '1.0' of './servicetest.cf' near line 20
I: Comment: Execute the start command for the service

Q: "....d/portmap star":  * Starting portmap daemon...
Q: "....d/portmap star":    ...done.
I: Last 2 QUOTEed lines were generated by promiser "/etc/init.d/portmap start"
I: Made in version '1.0' of './servicetest.cf' near line 20
I: Comment: Execute the start command for the service

# Now check to make sure cfengine started our services:
% sudo /etc/init.d/portmap status
 * portmap is running
% sudo /etc/init.d/ntp status    
 * NTP server is running.
Configuration management is an essential tool for sane and happy sysadmins. They help you ensure your systems are correctly configured without repeatedly consuming your time fighting to maintain the status quo.

Further reading: