Showing posts with label docker. Show all posts

December 7, 2021

Day 7 - Baking Multi-architecture Docker Images

By: Joe Block (@curiousbiped)
Edited by: Martin Smith (@martinb3)

My home lab cluster has a mix of CPU architectures - several Odroid HC2s that are arm7, another bunch of Raspberry Pi 4s and Odroid HC4s that are arm64 and finally a repurposed MacBook Air that is amd64. To further complicate things, they're not even all running the same linux distribution - some run Raspberry Pi OS, one's still on Raspbian, some are running debian (a mix of buster and bullseye), and the MacBook Air runs Ubuntu.

To reduce complication, the services in the cluster are all running in docker or containerd - it's a homelab, so I'm deliberately running multiple options to learn different tooling. This meant that I had to do three separate builds every time I updated one of my images, arm7 , arm64 and amd64, on three different machines, and my service startup scripts all had to determine what architecture they were running on and figure out what image tag to use.

Enter multi-architecture images

It used to be a hassle to create multi-architecture images. You'd have to create an image for each architecture, then upload them all separately from each build machine, then construct a manifest file that included references to all the different architecture images and then finally upload the manifest. This doesn't lead to easy rapid iteration.

Now, thanks to docker buildx, you can create multi-architecture images as easily as docker build creates them for single-architectures.

Let's take a look with an example on my system. First, I can see what architectures are supported with docker buildx ls. As of 2021-12-03, Docker Desktop for macOS supports the following:


        NAME/NODE       DRIVER/ENDPOINT             STATUS  PLATFORMS
        multiarch *     docker-container
          multiarch0    unix:///var/run/docker.sock running linux/amd64, linux/arm64, linux/riscv64, linux/ppc64le, linux/s390x, linux/386, linux/mips64le, linux/mips64, linux/arm/v7, linux/arm/v6
        desktop-linux   docker
          desktop-linux desktop-linux               running linux/amd64, linux/arm64, linux/riscv64, linux/ppc64le, linux/s390x, linux/386, linux/arm/v7, linux/arm/v6
        default         docker
          default       default                     running linux/amd64, linux/arm64, linux/riscv64, linux/ppc64le, linux/s390x, linux/386, linux/arm/v7, linux/arm/v6
        

My home lab only has three architectures, so in these examples I'm going to build for arm7, arm64 and amd64.

Create a builder

I need to create a builder that supports multi-architecture builds. This only needs to be done once as Docker Desktop will reuse it for all of my buildx builds.


    docker buildx create --name multibuild --use

Building a multi-architecture image

Now, when I build an image with docker buildx, all I have to do is specify a comma-separated list of desired platforms with --platform. Behind the scenes, Docker Desktop will fire up QEMU virtual machines for each architecture I specified, run the image builds in parallel, then create the manifest and upload everything.

As an example, I have a docker image, unixorn/unixorn-py3 that I use for my python projects that installs a minimal Python 3 onto debian 11-slim.

I build it with docker buildx build --platform linux/amd64,linux/arm/v7,linux/arm64 --push -t unixorn/debian-py3 resulting in the output below showing that it's building all three architectures.


        ❯ rake buildx
        Building unixorn/debian-py3
         docker buildx build --platform linux/amd64,linux/arm/v7,linux/arm64 --push -t unixorn/debian-py3 .
        [+] Building 210.4s (17/17) FINISHED
         => [internal] load build definition from Dockerfile                                                                                                            0.0s
         => => transferring dockerfile: 571B                                                                                                                            0.0s
         => [internal] load .dockerignore                                                                                                                               0.0s
         => => transferring context: 2B                                                                                                                                 0.0s
         => [linux/arm64 internal] load metadata for docker.io/library/debian:11-slim                                                                                   3.7s
         => [linux/arm/v7 internal] load metadata for docker.io/library/debian:11-slim                                                                                  3.6s
         => [linux/amd64 internal] load metadata for docker.io/library/debian:11-slim                                                                                   3.6s
         => [auth] library/debian:pull token for registry-1.docker.io                                                                                                   0.0s
         => [auth] library/debian:pull token for registry-1.docker.io                                                                                                   0.0s
         => [auth] library/debian:pull token for registry-1.docker.io                                                                                                   0.0s
         => [linux/arm64 1/2] FROM docker.io/library/debian:11-slim@sha256:656b29915fc8a8c6d870a1247aad7796ce296729b0ae95e168d1cfe30dd2fb3c                             4.4s
         => => resolve docker.io/library/debian:11-slim@sha256:656b29915fc8a8c6d870a1247aad7796ce296729b0ae95e168d1cfe30dd2fb3c                                         0.0s
         => => sha256:968621624b326084ed82349252b333e649eaab39f71866edb2b9a4f847283680 30.06MB / 30.06MB                                                                2.0s
         => => extracting sha256:968621624b326084ed82349252b333e649eaab39f71866edb2b9a4f847283680                                                                       2.4s
         => [linux/amd64 1/2] FROM docker.io/library/debian:11-slim@sha256:656b29915fc8a8c6d870a1247aad7796ce296729b0ae95e168d1cfe30dd2fb3c                             4.0s
         => => resolve docker.io/library/debian:11-slim@sha256:656b29915fc8a8c6d870a1247aad7796ce296729b0ae95e168d1cfe30dd2fb3c                                         0.0s
         => => sha256:e5ae68f740265288a4888db98d2999a638fdcb6d725f427678814538d253aa4d 31.37MB / 31.37MB                                                                1.8s
         => => extracting sha256:e5ae68f740265288a4888db98d2999a638fdcb6d725f427678814538d253aa4d                                                                       2.2s
         => [linux/arm/v7 1/2] FROM docker.io/library/debian:11-slim@sha256:656b29915fc8a8c6d870a1247aad7796ce296729b0ae95e168d1cfe30dd2fb3c                            4.3s
         => => resolve docker.io/library/debian:11-slim@sha256:656b29915fc8a8c6d870a1247aad7796ce296729b0ae95e168d1cfe30dd2fb3c                                         0.0s
         => => sha256:ba82a1312e1efdcd1cc6eb31cd40358dcec180da31779dac399cba31bf3dc206 26.57MB / 26.57MB                                                                2.3s
         => => extracting sha256:ba82a1312e1efdcd1cc6eb31cd40358dcec180da31779dac399cba31bf3dc206                                                                       2.0s
         => [linux/amd64 2/2] RUN apt-get update &&     apt-get install -y apt-utils ca-certificates --no-install-recommends &&     apt-get upgrade -y --no-install-r  22.3s
         => [linux/arm/v7 2/2] RUN apt-get update &&     apt-get install -y apt-utils ca-certificates --no-install-recommends &&     apt-get upgrade -y --no-install  176.9s
         => [linux/arm64 2/2] RUN apt-get update &&     apt-get install -y apt-utils ca-certificates --no-install-recommends &&     apt-get upgrade -y --no-install-  173.6s
         => exporting to image                                                                                                                                         25.4s
         => => exporting layers                                                                                                                                         6.7s
         => => exporting manifest sha256:ae5a5dcfe0028d32cba8d4e251cd7401c142023689a215c327de8bdbe8a4cba4                                                               0.0s
         => => exporting config sha256:48f97d6d8de3859a66625982c411f0aab062722a3611f18366ecff38ac4eafb9                                                                 0.0s
         => => exporting manifest sha256:fc7ad1e5f48da4fcb677d189dbc0abd3e155baf8f50eb09089968d1458fdcfb9                                                               0.0s
         => => exporting config sha256:60ced8a7d9dc49abbbcd02e7062268fdd2f14d9faedcb078b2980642ae959c3b                                                                 0.0s
         => => exporting manifest sha256:8f96f20d75502d5672f1be2d9646cbc5d5de3fcffd007289a688185714515189                                                               0.0s
         => => exporting config sha256:0c6e42f87110443450dbc539c97d99d3bfdd6dd78fb18cfdb0a1e3310f4c8615                                                                 0.0s
         => => exporting manifest list sha256:9133393fcebf2a2bdc85a6b7df34fafad55befa58232971b1b963d2ba0209efa                                                          0.0s
         => => pushing layers                                                                                                                                          17.2s
         => => pushing manifest for docker.io/unixorn/debian-py3:latest@sha256:9133393fcebf2a2bdc85a6b7df34fafad55befa58232971b1b963d2ba0209efa                         1.4s
         => [auth] unixorn/debian-py3:pull,push token for registry-1.docker.io                                                                                          0.0s
         => [auth] unixorn/debian-py3:pull,push token for registry-1.docker.io                                                                                          0.0s
         docker pull unixorn/debian-py3
        Using default tag: latest
        latest: Pulling from unixorn/debian-py3
        e5ae68f74026: Already exists
        86834dffc327: Pull complete
        Digest: sha256:9133393fcebf2a2bdc85a6b7df34fafad55befa58232971b1b963d2ba0209efa
        Status: Downloaded newer image for unixorn/debian-py3:latest
        docker.io/unixorn/debian-py3:latest
        1.60s user 1.05s system 1% cpu 3:36.49s total

One minor issue - docker buildx has a separate cache that it builds the images in, so when you build, the images won't be loaded in your local docker/containerd environment. If you want to have the image in your local docker environment, you need to run buildx with --load instead of --push.

In this example, instead of running docker run unixorn/debian-py3:amd64, docker run unixorn/debian-py3:arm7 or docker run unixorn/debian-py3:arm64 based on what machine I'm on, now I can use the same image reference on all the machines -


        ❯ docker run unixorn/debian-py3 python3 --version
        Python 3.9.2
        ❯
        

Takeaway

If you're running a mix of architectures in your lab environment, docker buildx will simplify things considerably.

No more maintaining multiple architecture tags, no more having to build on multiple machines, no more accidentally forgetting to update one of the tags so that things are mysteriously different on just some of our machines, no more weird issues because we forgot to update service start scripts and docker-compose.yml files.

Simpler is always better, and buildx will simplify the environment for you.

December 4, 2021

Day 5 - Least Privilege using strace

By: Shaun Mouton (@sdmouton)
Edited by: Jennifer Davis (@sigje)

Security in software development has been a hot-button issue for years. Increasing awareness of the threat posed by supply chain breaches have only increased the pressure on teams to improve security in all aspects of the software delivery and operation. A key premise is least privilege: granting the minimum privileges necessary to accomplish a task, in order to prevent folks from accessing or altering things they shouldn't have rights to. Here's my thinking, we should help users to apply the principles of least privilege when designing tools. When we find that we have not designed security tooling which does not enable least privilege use, we can still address the problem using tracing tools which can be found in most Linux distribution package repositories. I would like to share my adventure of looking at an InSpec profile (using CINC Auditor) and a container I found on Docker Hub to demonstrate how to apply least privilege using strace for process access auditing.

At my prior job working at Chef, I fielded a request asking how to run an InSpec profile as a user other than root. InSpec allows you to write policies in code (called InSpec Profiles) to audit the state of a system. Most of the documentation and practice at the time had users inspecting the system as root or a root-equivalent user. At first glance, this makes a certain amount of sense: many tools in the "let's configure the entire system" and "let's audit the security of the entire system" spaces need access to whatever the user decides they want to check against. Users can write arbitrary profile code for InSpec (and the open source CINC Auditor), ship those profiles around, and scan their systems to determine whether or not they're in compliance.

I've experienced this pain of excessive privileges with utilities myself. I can't count the number of times we'd get a request to install some vendor tool nobody had ever heard of with root privileges. Nobody who asked could tell us what it'd be accessing, whether it would be able to make changes to the system, or how much network/cpu/disk it'd consume. The vendor and the security department or DBAs or whoever would file a request with the expectation that we should just trust their assertion that nothing would go wrong. So, being responsible system administrators, we'd say "no, absolutely not, tell us what it's going to be doing first" or "yes, we'll get that work scheduled" and then never schedule the work. This put us in the position of being gatekeepers rather than enablers of responsible behavior. While justified, it never sat right with me.

(Note: It is deeply strange that vendors often can't tell customers what their tools do when asked in good faith, as is the idea that there should be an assumption of trustworthiness in that lack of information.)

I've found some tools over the years which might be able to give a user output which can be used to help craft something like a set of required privileges to run an arbitrary program with non-root privileges. Not too long ago I discussed "securing the supply chain" on how to design an ingestion pipeline to enable folks to run containers in a secure environment where they could be somewhat assured that a container using code they didn't write wasn't going to try to access things that they weren't comfortable with. I thought about this old desire of limiting privileges when running an arbitrary command, and figured that I should do a little digging to see if something already existed. If not maybe I could work towards a solution.

Now, I don't consider myself an expert developer but I have been writing or debugging code in one form or another since the '90s. I hope you consider this demo code with the expectation that someone wanting to do this in a production environment will re-implement what I've done far more elegantly. I hope that seeing my thinking and the work will help folks to understand a bit more about what's going on behind the scenes when you run arbitrary code, and to help you design better methods of securing your environment using that knowledge.

What I'll be showing here is the use of strace to build a picture of what is going on when you run code and how to approach crafting a baseline of expected system behavior using the information you can gather. I'll show two examples:

  • executing a relatively simple InSpec profile using the open source distribution's CINC Auditor
  • running a randomly selected container off Docker Hub (jjasghar/container_cobol)

Hopefully, seeing this work will help you solve a problem in your environment or avoid some compliance pain.

Parsing strace Output for an CINC Auditor (Chef InSpec) profile

There are other write-ups of strace functionality which go into broader and deeper detail on what's possible using it, I'll point to Julia Evans' work to get you started if you want to know more.

Strace is the venerable Linux debugger, and a good tool to use when coming up against a "what's going on when this program runs" problem. However, its output can be decidedly unfriendly. Take a look in the strace-output directory in this repo for the files matching the pattern linux-baseline.* to see the output of the following command:


        root@trace1:~# strace --follow-forks --output-separately --trace=%file -o
    /root/linux-baseline cinc-auditor exec linux-baseline

You can parse the output, however, if all you want to know is what files might need to be accessed (for an explanation of the command go here) you can do something similar to the following (maybe don't randomly sort the output and only show 10 lines):


awk -F '"' '{print $2}' linux-baseline/linux-baseline.108579 | sort -uR | head
/opt/cinc-auditor/embedded/lib/ruby/gems/2.7.0/gems/minitest-5.14.4/lib/nokogiri.so
/opt/cinc-auditor/embedded/lib/ruby/gems/2.7.0/gems/train-winrm-0.2.12/lib/psych/visitors.rb
/opt/cinc-auditor/embedded/lib/ruby/gems/2.7.0/gems/i18n-1.8.10/lib/rubygems/resolver/index_set.rb
/opt/cinc-auditor/embedded/lib/ruby/gems/2.7.0/gems/aws-sdk-cognitoidentityprovider-1.53.0/lib/inspec/resources/command.rb
/opt/cinc-auditor/embedded/lib/ruby/gems/2.7.0/gems/jwt-2.3.0/lib/rubygems/package/tar_writer.rb
/opt/cinc-auditor/embedded/lib/ruby/gems/2.7.0/gems/aws-sdk-codecommit-1.46.0/lib/pp.rb
/opt/cinc-auditor/embedded/lib/ruby/gems/2.7.0/extensions/x86_64-linux/2.7.0/ffi-1.15.4/http/2.rb
/opt/cinc-auditor/embedded/lib/ruby/gems/2.7.0/extensions/x86_64-linux/2.7.0/bcrypt_pbkdf-1.1.0/rubygems/package.rb
/opt/cinc-auditor/embedded/lib/ruby/gems/2.7.0/gems/aws-sdk-databasemigrationservice-1.53.0/lib/inspec/resources/be_directory.rb
/opt/cinc-auditor/embedded/lib/ruby/gems/2.7.0/gems/aws-sdk-ram-1.26.0/lib/rubygems/resolver/current_set.rb

You can start to build a picture of what all the user would need to be able to access in order to run a profile based on that output, but in order to go further I'll use a much more simple check:


        cinc-auditor exec linux-vsp/
    

Full results of that command are located in the strace-output directory with files matching the pattern linux-vsp.*, but to summarize what cinc-auditor/inspec is doing:

  • linux-vsp.109613 - this file shows all the omnibussed ruby files the cinc-auditor command tries to access in order to run its parent process
  • linux-vsp.109614 - why auditor is trying to run cmd.exe on a Linux system I don't yet know, you'll get used to seeing $PATH traversal very quickly
  • linux-vsp.109615 - I see a Get-WmiObject Win32_OperatingSys in there so we're checking to see if this is Windows
  • linux-vsp.109616 - more looking on the $PATH for Get-WmiObject so more Windows checking
  • linux-vsp.109617 - I am guessing that checking the $PATH for the Select command is more of the same
  • linux-vsp.109618 - Looking for and not finding ConvertTo-Json, this is a PowerShell cmdlet, right?
  • linux-vsp.109619 - Now we're getting somewhere on Linux, this running uname -s (with $PATH traversal info in there, see how used to this you are by now?)
  • linux-vsp.109620 - Now running uname -m
  • linux-vsp.109621 - Now running test -f /etc/debian_version
  • linux-vsp.109622 - Doing something with /etc/lsb-release but I didn't use the -v or -s strsize flags with strace so the command is truncated.
  • linux-vsp.109623 - Now we're just doing cat /etc/lsb-release using locale settings
  • linux-vsp.109624 - Checking for the inetd package
  • linux-vsp.109625 - Checking for the auditd package, its config directory /etc/dpkg/dpkg.cfg.d, and the config files /etc/dpkg/dpkg.cfg, and /root/.dpkg.cfg

Moving from that to getting an idea of what all a non-root user would need to be able to access, you can do something like this in the strace-output directory (explainshell here):


    find . -name "linux-vsp.10*" -exec awk -F '"' '{print $2}' {} \; | sort -u >
    linux-vsp_files-accessed.txt

You can see the output of this command here, but you'll need to interpret some of the output from the perspective of the program being executed. For example, I see "Gemfile" in there without a preceding path. I expect that's Auditor looking in the ./linux-vsp directory where the profile being called exists, and the other entries without a preceding path are probably also relative to the command being executed.

Parsing strace output of a container execution

I said Docker earlier, but I've got podman installed on this machine so that's what the output will reflect. You can find the output of the following command in the strace-output directory in files matching the pattern container_cobol.*, and wow. Turns out running a full CentOS container produces a lot of output. When scanning through the files, you see what looks like podman doing podman things, and what looks like the COBOL Hello World application executing in the container. As I go through these files I will call out anything particularly interesting I see along the way:


        root@trace1:~# strace -ff --trace=%file -o /root/container_cobol podman run -it container_cobol
        Hello world!
        root@trace1:~# ls -1 container_cobol.* | wc -l
        146

I'm not going to go through 146 files individually as I did previously, but this is an interesting data point:


        root@trace1:strace-output# find . -name "container_cobol.1*" -exec awk -F '"' '{print $2}' {} \; | sort -u > container_cobol_files-accessed.txt

        root@trace1:strace-output# wc -l container_cobol_files-accessed.txt
        637 container_cobol_files-accessed.txt
        
        root@trace1:strace-output# wc -l linux-vsp_files-accessed.txt
        104754 linux-vsp_files-accessed.txt

So the full CentOS container running a little COBOL Hello World application needs access to six hundred thirty seven files, and CINC Auditor running a 22-line profile directly on the OS needs to access over one hundred four thousand files. That doesn't directly mean that one is more or less of a security risk than the other, particularly given that a Hello World application can't report on the compliance state of your machines, containers, or applications for example, but it is fun to think about. One of the neatest things about debugging using tools which expose the underlying operations of a container exec is that you can reason about what containerization is actually doing. In this case, since we're showing what files are accessed during the container exec, sorting the list, and removing duplicate entries it's a cursory view but still useful.

Let's say we're consuming a vendor application as a container. We can trace an execution (or sample a running instance of the container for a day, strace can attach to running processes), load the list of files into the pipeline we use to promote new versions of that vendor app to prod, and when we see a change in the files that the application is opening we can make a determination whether the behavior of the new version is appropriate for our production environment with all the PII and user financial data. Now, instead of trusting the vendor at their word that they've done their due diligence, we're actually observing the behavior of the application and using our own knowledge of our environment to say whether that application is suitable for use.

But wait! Strace isn't just for files!

I used strace's file syscall filter as an example because it fit the example use case, but strace can snoop on other syscalls too! Do you need to know what IP addresses your process knows about? This example is using a container exec again, but you could snoop on an existing pid if you want then run a similar search against the output (IPs have been modified in this output):


        strace -ff --trace=%network -o /root/yourcontainer-network -s 10241 podman run -it yourcontainer
        for file in $(ls -1 yourcontainer-network.*); do grep -oP 'inet_addr\("\K[^"]+' $file ; done
        127.0.0.1
        127.0.0.1
        693.18.119.36
        693.18.119.36
        693.18.131.255
        75.5117.0.5
        75.5117.0.5
        75.5117.255.255
        161.888.0.2
        161.888.0.2
        161.888.15.255
        832.71.40.1
        832.71.40.1
        832.71.255.255

Have I answered my original question?

With all that knowledge, can we address the original question: Can one use the list of files output by tracing a cinc-auditor run to provide a restricted set of permissions which will allow one to audit the system using CINC Auditor and the profile with a standard user?

Yes, with one caveat: My Very Simple Profile was too simple, and didn't require any additional privileges. I tried with a few other public profiles, but every one I tried ran successfully using a standard user created with useradd -m cincauditor. I looked through bug reports related to running profiles as a non-root user but couldn't replicate their issues - which is good, I suppose. It could be that the issue my customer was facing at the time was a bug in the program's behavior when run as a non-root user which has been fixed, or I just don't remember the use case they presented well enough to replicate it. So here's a manufactured case:


root@trace1:~# mkdir /tmp/foo
root@trace1:~# touch /tmp/foo/sixhundred
root@trace1:~# touch /tmp/foo/sevenhundred
root@trace1:~# chmod 700 /tmp/foo
root@trace1:~# chmod 600 /tmp/foo/sixhundred
root@trace1:~# chmod 700 /tmp/foo/sevenhundred
cincauditor@trace1:~$ cat << EOF > linux-vsp/controls/filetest.rb
> control "filetester" do
>   impact 1.0
>   title "Testing files"
>   desc "Ensure they're owned by root"
>   describe file('/tmp/foo/sixhundred') do
>     its('owner') { should eq 'root' }
>   end
>   describe file('/tmp/foo/sevenhundred') do
>     its('group') { should eq 'root'}
>   end
> end
> EOF
cincauditor@trace1:~$ cinc-auditor exec linux-vsp/

Profile: Very Simple Profile (linux-vsp)
Version: 0.1.0
Target:  local://

  ×  filetester: Testing files (2 failed)
     ×  File /tmp/foo/sixhundred owner is expected to eq "root"

     expected: "root"
          got: nil

     (compared using ==)

     ×  File /tmp/foo/sevenhundred group is expected to eq "root"

     expected: "root"
          got: nil

     (compared using ==)

  ✔  inetd: Do not install inetd
     ✔  System Package inetd is expected not to be installed
  ↺  auditd: Check auditd configuration (1 skipped)
     ✔  System Package auditd is expected to be installed
     ↺  Can't find file: /etc/audit/auditd.conf


Profile Summary: 1 successful control, 1 control failure, 1 control skipped
Test Summary: 2 successful, 2 failures, 1 skipped

cincauditor@trace1:~$ find . -name "linux-vsp.1*" -exec awk -F '"' '{print $2}' {} \; | sort -u > linux-vsp_files-accessed.txt

root@trace1:~# diff --suppress-common-lines -y linux-vsp_files-accessed.txt /home/cincauditor/linux-vsp_files-accessed.txt | grep -v /opt/cinc-auditor
							      >	/home
							      >	/home/cincauditor
							      >	/home/cincauditor/.dpkg.cfg
							      >	/home/cincauditor/.gem/ruby/2.7.0
							      >	/home/cincauditor/.gem/ruby/2.7.0/specifications
							      >	/home/cincauditor/.inspec
							      >	/home/cincauditor/.inspec/cache
							      >	/home/cincauditor/.inspec/config.json
							      >	/home/cincauditor/.inspec/gems/2.7.0/specifications
							      >	/home/cincauditor/.inspec/plugins
							      >	/home/cincauditor/.inspec/plugins.json
							      >	/home/cincauditor/linux-vsp
/root							      <
/root/.dpkg.cfg						      <
/root/.gem/ruby/2.7.0					      <
/root/.gem/ruby/2.7.0/specifications			      <
/root/.inspec						      <
/root/.inspec/cache					      <
/root/.inspec/config.json				      <
/root/.inspec/gems/2.7.0/specifications			      <
/root/.inspec/plugins					      <
/root/.inspec/plugins.json				      <
/root/linux-vsp						      <
							      >	/tmp/foo/sevenhundred
							      >	/tmp/foo/sixhundred
							      >	linux-vsp/controls/filetest.rb
root@trace1:~#

The end of that previous block's output shows compiling the list of files accessed when the cincauditor user runs the profile in the same way we did for the root user, then a diff of the two files. Looking at that output, it's fairly obvious that the profile is trying to access the newly created files which are in a directory we made inaccessible to the cincauditor user (with chmod 700 /tmp/foo), and when we give cinc-auditor access to that directory with chmod 750 /tmp/foo the profile is able to check those files. A manufactured replication of the use case, but it does show that it's possible to use the output to accomplish the task. Whether chmod is the right way to give an least-privilege user access to the files is a question best left up to the implementer, their organization, and their auditors - the purpose of this exercise is to demonstrate the potential value of the strace debugger.

It is important to note that file permissions aren't the only reason why a program wouldn't run. If you're not able to use the information strace gives you to get an application to run as a user with restricted privileges, at least you can get more information about what is happening under the hood and can communicate about why a program is not suitable for your environment. If a program needs to run anyway, you can profile the application's behavior (perhaps a tool built on eBPF would be more suitable than strace for ongoing monitoring in a production environment) and notify when its behavior changes.

Closing thoughts

Over the past few years I've had a lot of thoughts about how do get things done in modern environments, and I've come to the conclusion that it's okay to write shell scripts to get something like this done. Since in this case I'm wrapping arbitrary tasks so I can extract information about what happens when they're running, and I won't be able to predict where I'll need it I figured it was a good idea to use bash and awk as those will be available via package manager where I want to do this sort of thing.

You might not agree, and wish to see something like this implemented in something like Ruby, Python, or Rust (I have to admit that I thought about trying to do this using Rust so as to get better at it), and you're of course welcome to do so. Again, I chose shell since it's something many folks can easily run, look at, comprehend, modify, and re-implement in the way that suits them.

Lastly, thanks very much to Julia Evans. A note about the power of storytelling in one of her posts made me think "I should write a story about solving this problem so I can be sure I learned something from it", and I hope I've done a decent job of emulating her empathy towards folks learning these concepts for the first time. 

December 19, 2016

Day 19 - Troubleshooting Docker and Kubernetes

Written by: Jorge Salamero (@bencerillo)
Edited by: Brian O'Rourke (@borourke)

Container orchestration platforms like Kubernetes, DC/OS Mesos or Docker Swarm help towards making your experience like riding an unicorn over a rainbow, but don’t help much with troubleshooting containers:

  • They are isolated, there is a barrier between you and the process you want to monitor and traditional troubleshooting tools run on the host doesn’t understand containers, namespaces and orchestration platforms.
  • They bring a minimal runtime, just the service and its dependencies without all the troubleshooting tools, think of troubleshooting with just busybox!
  • They are scheduled across your cluster… containers move, scale up and down. Are highly volatile, appearing and disappearing as the process ends, gone.
  • And talk to each other through new virtual network layers.

Today we will demonstrate through a real use case how to do troubleshooting in Kubernetes. The scenario will use is a simple Kubernetes service with 3 Nginx pods and a client with curl. In the previous link you will find the backend.yaml file we will use for this scenario.

If you are new to Kubernetes services, we explained how to deploy this service and learned how it works in Understanding how Kubernetes DNS Services work.To bring up the setup, will run:

$ kubectl create namespace critical-appnamespace “critical-app” created$ kubectl create -f backend.yamlservice “backend” createddeployment “backend” created

And then will spawn a client to load our backend service:

$ kubectl run -it –image=tutum/curl client –namespace critical-app –restart=Never

Part1: Network troubleshooting Kubernetes services

From our client container we could simply run a test by doing root@client:/# curl backend to see how our Kubernetes service works. But we don’t want to leave things loose and we thought that using fully qualified domain names is a good idea. If we go and check Kubernetes documentation it says that every service gets this default DNS entry: my-svc.my-namespace.svc.cluster.local. So let’s instead use the full domain name.Let’s go back to the curl client container shell and run: root@client:/# curl backend.critical-app.svc.cluster.local. But this time curl hangs for 10 seconds and then correctly returns the expected website! As a distributed systems engineer, this is one of the worst things that can happen: you want something to fail or succeed straight away, not a wait of 10 seconds.To troubleshoot what’s going on, we will use sysdig. Sysdig is an open source linux visibility tool that offers native visibility into containers, including Docker, Kubernetes, DC/OS, and Mesos just to name a few. Combining the functionality of htop, tcpdump, strace, lsof, netstat, etc in one open source tool, Sysdig gives you all of the system calls and application data in the context of your Kubernetes infrastructure. Monitoring Kubernetes with Sysdig is a good introduction to using the tool with Kubernetes.

To analyze what is going on, we will ask sysdig to dump all the information into a capture file:$ sudo sysdig -k http://127.0.0.1:8080 -s8192 -zw capture.scap

I’ll quickly explain each parameter here:

-k http://localhost:8080 connects to Kubernetes API

-s8192 enlarges the IO buffers, as we need to show full content, otherwise gets cut off by default

-zw capture.scap compresses and dumps into a file all system calls and metadataIn parallel, we’ll reproduce this hairy issue again running the curl command: # curl backend.critical-app.svc.cluster.local. This ensures that we have all the appropriate data in the file we captured above to reproduce the scenario and troubleshoot the issue.Once curl returns, we can Ctrl+C sysdig to stop the capture, and we will have a ~10s capture file of everything that happened in our Kubernetes host. We can now start troubleshooting the issue either in the cluster or out of band, basically anywhere we copy the file with sysdig installed.$ sysdig -r capture.scap -pk -NA “fd.type in (ipv4, ipv6) and (k8s.ns.name=critical-app or proc.name=skydns)” | less

Let me explain each parameter here as well:

-r capture.scap reads from a capture file

-pk prints Kubernetes fields in stdout

-NA shows ASCII output

And the filter between double quotes. Sysdig is able to understand Kubernetes semantics so we can filter out traffic on sockets IPv4 or IPv6, coming from any container in the namespace critical-app or from any process named skydns. We included proc.name=skydns because this is the internal Kubernetes DNS resolver and runs outside our namespace, as part of the Kubernetes infrastructure.

Sysdig also has an interactive ncurses interface htop alike

In order to follow along with this troubleshooting example, you can download the capture file capture.scap and explore it yourself with sysdig.Immediately we see how curl tries to resolve the domain name but on the DNS query payload we have something odd (10049): backend.critical-app.svc.cluster.local.critical-app.svc.cluster.local. Seems like for some reason curl didn’t understand I gave it a fully qualified domain name already and decided to append a search domain to it.

[…]

10030 16:41:39.536689965 0 client (b3a718d8b339) curl (22370:13) < socket fd=3(<4>) 10031 16:41:39.536694724 0 client (b3a718d8b339) curl (22370:13) > connect fd=3(<4>) 10032 16:41:39.536703160 0 client (b3a718d8b339) curl (22370:13) < connect res=0 tuple=172.17.0.7:46162->10.0.2.15:53 10048 16:41:39.536831645 1 <NA> (36ae6d09d26e) skydns (17280:11) > recvmsg fd=6(<3t>:::53) 10049 16:41:39.536834352 1 <NA> (36ae6d09d26e) skydns (17280:11) < recvmsg res=87 size=87 data=backendcritical-appsvcclusterlocalcritical-appsvcclusterlocal tuple=::ffff:172.17.0.7:46162->:::53 10050 16:41:39.536837173 1 <NA> (36ae6d09d26e) skydns (17280:11) > recvmsg fd=6(<3t>:::53)

[…]

SkyDNS makes a request (10097) to /local/cluster/svc/critical-app/local/cluster/svc/critical-app/backend through the etcd API. Obviously etcd doesn’t recognize that service and returns (10167) a “Key not found”. This is passed back to curl via DNS query response.

[…]

10096 16:41:39.538247116 1 <NA> (36ae6d09d26e) skydns (4639:8) > write fd=3(<4t>10.0.2.15:34108->10.0.2.15:4001) size=221 10097 16:41:39.538275108 1 <NA> (36ae6d09d26e) skydns (4639:8) < write res=221 data=GET /v2/keys/skydns/local/cluster/svc/critical-app/local/cluster/svc/critical-app/backend?quorum=false&recursive=true&sorted=false HTTP/1.1Host: 10.0.2.15:4001User-Agent: Go 1.1 package httpAccept-Encoding: gzip10166 16:41:39.538636659 1 <NA> (36ae6d09d26e) skydns (4617:1) > read fd=3(<4t>10.0.2.15:34108->10.0.2.15:4001) size=4096 10167 16:41:39.538638040 1 <NA> (36ae6d09d26e) skydns (4617:1) < read res=285 data=HTTP/1.1 404 Not FoundContent-Type: application/jsonX-Etcd-Cluster-Id: 7e27652122e8b2aeX-Etcd-Index: 1259Date: Thu, 08 Dec 2016 15:41:39 GMTContent-Length: 112{“errorCode”:100,“message”:“Key not found”,“cause”:“/skydns/local/cluster/svc/critical-app/local”,“index”:1259}

[…]

curl doesn’t give up and tries again (10242) but this time with backend.critical-app.svc.cluster.local.svc.cluster.local. Looks like curl is trying a different search domain this time, as critical-app was removed from the appended domain. Of course, when forwarded to etcd (10274), this fails again (10345).

[…]

10218 16:41:39.538914765 0 client (b3a718d8b339) curl (22370:13) < connect res=0 tuple=172.17.0.7:35547->10.0.2.15:53 10242 16:41:39.539005618 1 <NA> (36ae6d09d26e) skydns (17280:11) < recvmsg res=74 size=74 data=backendcritical-appsvcclusterlocalsvcclusterlocal tuple=::ffff:172.17.0.7:35547->:::53 10247 16:41:39.539018226 1 <NA> (36ae6d09d26e) skydns (17280:11) > recvmsg fd=6(<3t>:::53) 10248 16:41:39.539019925 1 <NA> (36ae6d09d26e) skydns (17280:11) < recvmsg res=74 size=74 data=0]backendcritical-appsvcclusterlocalsvcclusterlocal tuple=::ffff:172.17.0.7:35547->:::53 10249 16:41:39.539022522 1 <NA> (36ae6d09d26e) skydns (17280:11) > recvmsg fd=6(<3t>:::53) 10273 16:41:39.539210393 1 <NA> (36ae6d09d26e) skydns (4639:8) > write fd=3(<4t>10.0.2.15:34108->10.0.2.15:4001) size=208 10274 16:41:39.539239613 1 <NA> (36ae6d09d26e) skydns (4639:8) < write res=208 data=GET /v2/keys/skydns/local/cluster/svc/local/cluster/svc/critical-app/backend?quorum=false&recursive=true&sorted=false HTTP/1.1

Host: 10.0.2.15:4001User-Agent: Go 1.1 package httpAccept-Encoding: gzip10343 16:41:39.539465153 1 <NA> (36ae6d09d26e) skydns (4617:1) > read fd=3(<4t>10.0.2.15:34108->10.0.2.15:4001) size=4096 10345 16:41:39.539467440 1 <NA> (36ae6d09d26e) skydns (4617:1) < read res=271 data=HTTP/1.1 404 Not Found[…]

curl will try once again, this time appending cluster.local as we can see the DNS query request (10418) to backend.critical-app.svc.cluster.local.cluster.local. This one (10479) obviously fails as well (10524), again.

[…]

10396 16:41:39.539686075 0 client (b3a718d8b339) curl (22370:13) < connect res=0 tuple=172.17.0.7:40788->10.0.2.15:53 10418 16:41:39.539755453 0 <NA> (36ae6d09d26e) skydns (17280:11) < recvmsg res=70 size=70 data=backendcritical-appsvcclusterlocalclusterlocal tuple=::ffff:172.17.0.7:40788->:::53 10433 16:41:39.539800679 0 <NA> (36ae6d09d26e) skydns (17280:11) > recvmsg fd=6(<3t>:::53) 10434 16:41:39.539802549 0 <NA> (36ae6d09d26e) skydns (17280:11) < recvmsg res=70 size=70 data=backendcritical-appsvcclusterlocalclusterlocal tuple=::ffff:172.17.0.7:40788->:::53 10437 16:41:39.539805177 0 <NA> (36ae6d09d26e) skydns (17280:11) > recvmsg fd=6(<3t>:::53) 10478 16:41:39.540166087 1 <NA> (36ae6d09d26e) skydns (4639:8) > write fd=3(<4t>10.0.2.15:34108->10.0.2.15:4001) size=204 10479 16:41:39.540183401 1 <NA> (36ae6d09d26e) skydns (4639:8) < write res=204 data=GET /v2/keys/skydns/local/cluster/local/cluster/svc/critical-app/backend?quorum=false&recursive=true&sorted=false HTTP/1.1Host: 10.0.2.15:4001User-Agent: Go 1.1 package httpAccept-Encoding: gzip10523 16:41:39.540421040 1 <NA> (36ae6d09d26e) skydns (4617:1) > read fd=3(<4t>10.0.2.15:34108->10.0.2.15:4001) size=4096 10524 16:41:39.540422241 1 <NA> (36ae6d09d26e) skydns (4617:1) < read res=267 data=HTTP/1.1 404 Not Found[…]

To the untrained eye, it might look that we have found the issue: a bunch of inefficient calls. But actually this is not true. If we look at the timestamps, the difference between the first etcd request (10097) and the last one (10479), the timestamps in the second column are less than 10ms apart. We are looking at an issue of seconds, not milliseconds - so where is the wait then?When we keep looking through the capture file, we can see that curl doesn’t stop trying with DNS queries to SkyDNS, now with backend.critical-app.svc.cluster.local.localdomain (10703). This .localdomain is not recognized by SkyDNS as an internal domain for Kubernetes so instead of going to etcd, it decides to forward this query to its upstream DNS resolver (10691).

[…]

10690 16:41:39.541376928 1 <NA> (36ae6d09d26e) skydns (4639:8) > connect fd=8(<4>) 10691 16:41:39.541381577 1 <NA> (36ae6d09d26e) skydns (4639:8) < connect res=0 tuple=10.0.2.15:44249->8.8.8.8:53 10702 16:41:39.541415384 1 <NA> (36ae6d09d26e) skydns (4639:8) > write fd=8(<4u>10.0.2.15:44249->8.8.8.8:53) size=68 10703 16:41:39.541531434 1 <NA> (36ae6d09d26e) skydns (4639:8) < write res=68 data=Nbackendcritical-appsvcclusterlocallocaldomain 10717 16:41:39.541629507 1 <NA> (36ae6d09d26e) skydns (4639:8) > read fd=8(<4u>10.0.2.15:44249->8.8.8.8:53) size=512 10718 16:41:39.541632726 1 <NA> (36ae6d09d26e) skydns (4639:8) < read res=-11(EAGAIN) data= 58215 16:41:43.541261462 1 <NA> (36ae6d09d26e) skydns (4640:9) > close fd=7(<4u>10.0.2.15:54272->8.8.8.8:53) 58216 16:41:43.541263355 1 <NA> (36ae6d09d26e) skydns (4640:9) < close res=0

[…]

Scanning down the timestamp column we see the first large gap when SkyDNS sends out a request and then hangs for about 4 seconds (10718-58215). Given that .localdomain is not a valid TLD (top level domain), the upstream server will be just ignoring this request. After the timeout, SkyDNS tries again with the same query (75923), hanging for another few more seconds (75927-104208). In total we have been waiting around 8 seconds for a DNS entry that doesn’t exist and is being ignored.

[…]

58292 16:41:43.542822050 1 <NA> (36ae6d09d26e) skydns (4640:9) < write res=68 data=Nbackendcritical-appsvcclusterlocallocaldomain 58293 16:41:43.542829001 1 <NA> (36ae6d09d26e) skydns (4640:9) > read fd=8(<4u>10.0.2.15:56371->8.8.8.8:53) size=512 58294 16:41:43.542831896 1 <NA> (36ae6d09d26e) skydns (4640:9) < read res=-11(EAGAIN) data= 75904 16:41:44.543459524 0 <NA> (36ae6d09d26e) skydns (17280:11) < recvmsg res=68 size=68 data=[…]

75923 16:41:44.543560717 0 <NA> (36ae6d09d26e) skydns (17280:11) < recvmsg res=68 size=68 data=Nbackendcritical-appsvcclusterlocallocaldomain tuple=::ffff:172.17.0.7:47441->:::53 75927 16:41:44.543569823 0 <NA> (36ae6d09d26e) skydns (17280:11) > recvmsg fd=6(<3t>:::53) 104208 16:41:47.551459027 1 <NA> (36ae6d09d26e) skydns (4640:9) > close fd=7(<4u>10.0.2.15:42126->8.8.8.8:53) 104209 16:41:47.551460674 1 <NA> (36ae6d09d26e) skydns (4640:9) < close res=0

[…]But finally, it all works! Why? curl stops trying to patch things and applying search domains. It tries the domain name verbatim as we typed in the command line. The DNS request is resolved by SkyDNS through the etcd API request (104406). A connection is opened against the service IP address (107992), then forwarded to the pod with iptables and the HTTP response travels back to the curl container (108024).

[…]

104406 16:41:47.552626262 0 <NA> (36ae6d09d26e) skydns (4639:8) < write res=190 data=GET /v2/keys/skydns/local/cluster/svc/critical-app/backend?quorum=false&recursive=true&sorted=false HTTP/1.1[…]

104457 16:41:47.552919333 1 <NA> (36ae6d09d26e) skydns (4617:1) < read res=543 data=HTTP/1.1 200 OK[…]

{“action”:“get”,“node”:{“key”:“/skydns/local/cluster/svc/critical-app/backend”,“dir”:true,“nodes”:[{“key”:“/skydns/local/cluster/svc/critical-app/backend/6ead029a”,“value”:“{\"host\”:\“10.3.0.214\”,\“priority\”:10,\“weight\”:10,\“ttl\”:30,\“targetstrip\”:0}“,"modifiedIndex”:270,“createdIndex”:270}],“modifiedIndex”:270,“createdIndex”:270}}[…]

107992 16:41:48.087346702 1 client (b3a718d8b339) curl (22369:12) < connect res=-115(EINPROGRESS) tuple=172.17.0.7:36404->10.3.0.214:80 108002 16:41:48.087377769 1 client (b3a718d8b339) curl (22369:12) > sendto fd=3(<4t>172.17.0.7:36404->10.3.0.214:80) size=102 tuple=NULL 108005 16:41:48.087401339 0 backend-1440326531-csj02 (730a6f492270) nginx (7203:6) < accept fd=3(<4t>172.17.0.7:36404->172.17.0.5:80) tuple=172.17.0.7:36404->172.17.0.5:80 queuepct=0 queuelen=0 queuemax=128 108006 16:41:48.087406626 1 client (b3a718d8b339) curl (22369:12) < sendto res=102 data=GET / HTTP/1.1[…]

108024 16:41:48.087541774 0 backend-1440326531-csj02 (730a6f492270) nginx (7203:6) < writev res=238 data=HTTP/1.1 200 OKServer: nginx/1.10.2[…]

Looking at how things operate at the system level we can conclude that there are two different issues as the root cause of this problem. First, curl doesn’t trust me when I give it a FQDN and tries to apply a search domain algorithm. Second, .localdomain should have never been there because it’s not routable within our Kubernetes cluster.If for a second you thought this could have been done using tcpdump, you haven’t tried yourself yet. I’m 100% sure is not going to be installed inside your container. You can run it outside from the host, but good luck finding the network interface matching the network namespace of the container that Kubernetes scheduled. If you don’t buy me, keep reading: we are not done with the troubleshooting yet.

Part2: DNS resolution troubleshooting

Let’s have a look at what’s in the resolv.conf file. The container could be gone already, or the file could have changed after the curl call.  But we have a sysdig capture that contains everything that happened.

Usually containers live as long as the process running inside them, disappearing when that process dies. This is one of the most challenging parts of troubleshooting containers. How we can explore something that’s gone already? How we can reproduce exactly what happened? Sysdig capture files come extremely useful in these cases.

Let’s analyze the capture file but instead of filtering the network traffic, we will filter on that file this time. We want to see resolv.conf exactly as it was read by curl, to confirm what we thought, it contains the localdomain.

$ sysdig -pk -NA -r capture.scap -c echo_fds “fd.type=file and fd.name=/etc/resolv.conf”—— Read 119B from  [k8s_client.eee910bc_client_critical-app_da587b4d-bd5a-11e6-8bdb-028ce2cfb533_bacd01b6] [b3a718d8b339]  /etc/resolv.conf (curl)

search critical-app.svc.cluster.local svc.cluster.local cluster.local localdomain

nameserver 10.0.2.15

options ndots:5

[…]

Here’s a new way to use sysdig:

-c echo_fds uses a Sysdig chisel - an add-on script - to aggregate the information and to format the output.

Also the filter includes only IO activity on file descriptors that are a file and with the name /etc/resolv.conf, exactly what we are looking for.Through the syscalls, we see there is an option called ndots. This option is the reason why curl didn’t trust our FQDN (fully qualified domain name) but tried to append all the search domain first. If you read the manpage, ndots forces libc that any resolution on a domain name with less than 5 dots won’t be treated as a fqdn but will try to first append all the search domains. ndots is there for a good reason, so we can perform a curl backend. But who added localdomain there?

Part3: Troubleshooting Docker containers run by Kubernetes

We don’t want to finish our troubleshooting without finding the culprit for this localdomain. That way, we can blame software and not people :) Was Docker who added that search domain? Or Kubernetes instructing Docker when creating the container?.

Since we know that all control communication between Kubernetes and Docker is done through a Unix socket, we can use that to filter things out:$ sudo sysdig -pk -s8192 -c echo_fds -NA “fd.type in (unix) and evt.buffer contains localdomain”

This time we will be capturing live with the help of an awesome filter, evt.buffer contains. This filter takes all the events buffers and if it contains the string we are looking for, will be considered for printing by our chisel that formats the output.

Now I need to create a new client to spy on what happens at container orchestration time:$ kubectl run -it –image=tutum/curl client-foobar –namespace critical-app –restart=NeverI can see that hyperkube, which is part of Kubernetes, wrote on /var/run/docker.sock using Docker API an HTTP POST request to /containers/create. If we read through it, we will find how this request contains an option “DnsSearch”:[“critical-app.svc.cluster.local”, “svc.cluster.local”, “cluster.local”, “localdomain”]. Kubernetes, we caught you!. Most probably it was there for some reason, like my local development machine having that search domain set up. In any case, that’s a different story.

[…]

—— Write 2.61KB to  [k8s-kubelet] [de7157ba23c4]   (hyperkube)POST /containers/create?name=k8s_POD.d8dbe16c_client-foobar_critical-app_085ac98f-bd64-11e6-8bdb-028ce2cfb533_9430448e HTTP/1.1Host: docker[…]

  "DnsSearch":[“critical-app.svc.cluster.local”,“svc.cluster.local”,“cluster.local”,“localdomain”],

[…]

Conclusion

Reproducing exactly what happened inside container can be very challenging as they terminate when the process dies or just ends. Sysdig captures contain all the information through the system calls including network traffic, file system I/O and processes behaviour providing all the data required for troubleshooting.

When troubleshooting in a container environment, being able to filter and add container contextual information like Docker container names or Kubernetes metadata makes our lives significantly easier.

Sysdig is available in all the main Linux distros, for OSX and also Windows. Download it from here to get the last version. Sysdig is an open source tool but the company behind the project also offers a commercial product to monitor and troubleshoot containers and microservices across multiple hosts.

December 11, 2016

Day 11 - Going from local Docker-compose to Kubernetes

Written by: Sebastien Goasguen (@sebgoa)
Edited by: Daniel Kang (@kangman)

In this Sysadvent blog we will look at a neat tool called kompose which is part of the Kubernetes incubator. Kompose lets you go easily from Docker-compose application manifests to Kubernetes.

Docker has a great user experience, developers can quickly install the Docker engine on their local machine and get started pulling images, building their own and running containers. After building a few images and to avoid writing bash wrappers to launch multiple containers, Compose enters your arsenal. With it you can write a YAML file that describes the several containers you want to manage to run your distributed application.

A quick look at Compose

Docker compose is again easy to install on your local machine. The format of the Compose files is also very intuitive. For example to launch a single container, the simplest Compose file you could write would be something like:

version: '2'

services:
   redis:
     image: redis

You see a version being defined (yes, there was a version 1), and then a list of services. In this example we only have one service called redis, that service is defined by a single Docker image: redis which will be pulled form the Docker Hub.

To launch this toy Compose application, you use the docker-compose CLI and run docker-compose up. This is quite handy, all the parameters that you use for your docker run commands can be specified in the YAML manifest, and it is better than writing your own BASH wrappers.

Enters Kubernetes

However, what happens if you want to take this distributed application and start it on a Kubernetes cluster ? Kubernetes is quickly becoming the container orchestration of choice, and a great alternative to Docker Swarm. In this post we will not go into pros and cons of both system and just consider that you may be interested in using Kubernetes in your data-center, while developers will have created their application using Docker compose.

To move to Kubernetes, you could start from scratch, learn the API and the specifications, or you could use kompose and save yourself some time.

In Kubernetes, to keep it simple, applications are made of a set of deployments and services. A deployment is a declarative manifest that tells the cluster what should be running. A service is a network abstraction to provide network ingress to your containers. Both of these are defined either in JSON or YAML and created via the API server using the kubectl Kubernetes client.

If you want to get started quickly with Kubernetes, you should try out minikube. With an endpoint handy and the CLI installed, starting redis like we did in the previous section would be a single command:

kubectl run redis --image=redis

However your real application is probably more complex than a single container image, and your Compose file will be longer and more detailed.

That’s where kompose becomes handy, it automatically transforms your Compose file into Kubernetes deployments and services and calls the API server to launch the application. Let’s have a closer look.

Convert Compose format to Kubernetes manifests

In recent Docker events, the Docker Voting App has become quite popular to show case Docker’s ability to build, ship and run. It is made of five containers, each written in a different language. A frontend allows you to cast a vote, another frontend allows you to see the result. In the backend, a redis queue collects the votes, a worker stores them in a database. This is a show-case application, by no means does this represent best practice for such an application !

To launch it, a Docker compose file could look like this:

version: "2"

services:
  vote:
    image: docker/example-voting-app-vote:latest
    labels:
     - "com.example.description=Vote"
     - "kompose.service.type=nodeport"
    ports:
      - "5000:80"

  redis:
    image: redis:alpine
    ports: ["6379"]

  worker:
    image: docker/example-voting-app-worker:latest

  db:
    image: postgres:9.4
    ports: ["5432"]
    labels:
     - "com.example.description=Postgres Database"

  result:
    image: tmadams333/example-voting-app-result:latest
    ports:
      - "5001:80"
    labels:
    - "kompose.service.type=nodeport"

Note that in this example we used pre-built images. Compose can build images on the fly if you have the source code and the required Dockerfiles. Also note that we set some specific labels for kompose to be able to give extrenal access to the web frontends of the application.

But how can you easily run this on Kubernetes ? The answer is to use kompose.

A single command similar to docker-compose will start the application on Kubernetes:

kompose -f docker-voting.yml up

This will transform each service into a Kubernetes deployment object, expose it via a Kubernetes service object and launch everything on your cluster. You will then be able to manage the application with the regular Kubernetes CLI kubectl, for example listing the deployments:

$ kubectl get deployments
NAME      DESIRED   CURRENT   UP-TO-DATE   AVAILABLE   AGE
db        1         1         1            1           38m
redis     1         1         1            1           38m
result    1         1         1            1           38m
vote      1         1         1            1           38m
worker    1         1         1            1           38m

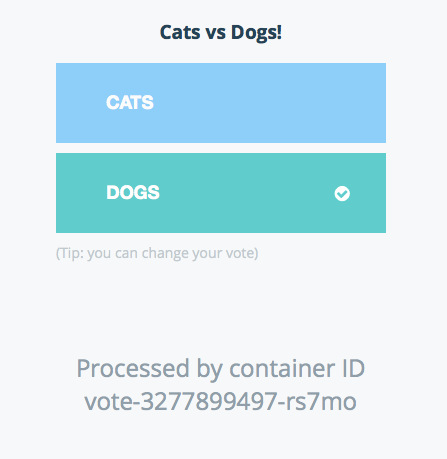
You will then be able to access the vote and result frontend through their Kubernetes services, and decide which your prefer, Cats or Dogs.

To do this, use the kubectl describe command and list the the vote and result services. You will see a random high port in the NodePort section. Open your browser on one of the nodes of your Kubernetes cluster (i.e kubectl get nodes) specifying those ports and you will see the web frontends. For example, the sample below shows that the vote application is available on port 31940:

$ kubectl describe svc vote
Name:   vote
Namespace:  default
Labels:   service=vote
Selector:  service=vote
Type:   NodePort
IP:   10.0.155.137
Port:   5000 5000/TCP
NodePort:  5000 31940/TCP
Endpoints:  <none>
Session Affinity: None

catdog.png

Changing kompose behavior

This up command can appear quite magical, if you want to change this behavior, check the usage of kompose. You will see that you can use the convert sub commands with various flags. I won’t cover all of them, but a few things are quite neat.

First you can output the converted objects to stdtout and specify whether you like JSON or YAML.

kompose -f docker-voting.yml --stdout --yaml
apiVersion: v1
items:
- apiVersion: v1
  kind: Service
  metadata:
    annotations:
      com.example.description: Postgres Database
    creationTimestamp: null
...

And if you know Kubernetes objects you can change the default behavior and instead of creating deployments, you can create DaemonSets, ReplicationControllers, or Charts.

kompose -f docker-voting.yml convert --daemonset --stdout --yaml
...
- apiVersion: extensions/v1beta1
  kind: DaemonSet
  metadata:
    annotations:
      com.example.description: Postgres Database
    creationTimestamp: null
    name: db
  spec:
    template:
...

Wrapping up

On your journey to using containers, you will most likely develop Docker compose files. There is currently no standard to define containerized distributed applications, therefore tools like kompose which allow easy transformation of application manifests between different container orchestrators are going to be quite useful.

With kompose you can quickly start experimenting with Kubernetes and learn the different API objects that make up this powerful API. Give it a Shot !

December 13, 2015

Day 13 - An introduction to OpenShift 3

Written by: Tobias Brunner (@tobruzh)
Edited by: Nick Silkey (@filler)

Over the last year there has been a lot of buzz around open-source Platform-as-a-Service (PaaS) tools. This blog will give you an overview of this topic and some deeper insight into Red Hat OpenShift 3. It will talk about the kind of PaaS tools you install on your own infrastructure - be it physical, virtual or anywhere in the cloud. It does not cover installation atop Heroku or similar services, which are hosted PaaS solutions.

But what exactly is meant by PaaS?

When we talk about PaaS, we mean a collection of services and functions which serve to orchestrate the processes involved with building software up to running it in production. All software tasks are completely automated: building, testing, deploying, running, monitoring, and more. Software will be deployed by a mechanism similar to "git push" to a remote source code repository which triggers all the automatic processes around it. While every PaaS platform behaves a bit differently, in the end they all do the same function of running applications.

Regarding running an application within a PaaS, the application should optimally be designed with some best practices in mind. A good guideline which incorporates these practices is commonly known as the The Twelve-Factor App.

Short overview of Open Source PaaS platforms

There are a lot of Open Source PaaS tools in this space as of late

  • Dokku: http://progrium.viewdocs.io/dokku/ A simple, small PaaS running on one host. Uses Docker and Nginx as the most important building blocks. It is written in Bash and uses Buildpacks to build an application specific Docker container.

  • Deis: http://deis.io/ The big sister of Dokku. Building blocks used in Deis include CoreOS, Ceph, Docker, and a pluggable scheduler (Fleet by default, however Kubernetes will be available in the future). Buildpacks are used for creating the runtime containers. At least three servers are needed to effectively run Deis.

  • Tsuru: https://tsuru.io/ Similar to Deis, but says it also supports non-12-Factor apps. There is even a possibility to manage VMs, not only containers. This, too, uses Docker as building block. Other components like scheduler are coming from the Tsuru project.

  • Flynn: https://flynn.io/ Also similar to the two tools above. It also uses Docker as backend, but uses many project specific helper services. At the moment, only PostgreSQL is supported as a datastore for applications.

  • Apache Stratos: http://stratos.apache.org/ This is more of a framework than just a "simple" platform. It is highly multi-tenant enabled and provides a lot of customization features. The architecture is very complex and has a lot of moving parts. Supports Docker and Kubernetes.

  • Cloud Foundry: https://www.cloudfoundry.org/ One of the biggest player besides OpenShift in this market. It provides a platform for running applications and is used widely in the industry. Has a steep learning curve and is not easily installed,configured, or operated

  • OpenShift: http://www.openshift.org/ Started in 2011 as a new PaaS platform using it’s own project specific technologies, has been completely rewritten in v3 using Docker and Kubernetes as the underlying building blocks.

OpenShift

There are some compelling reasons to look at OpenShift:

  • Usage of existing technology Kubernetes and Docker are supported by big communities and are good selections to serve as central components upon which OpenShift is built. OpenShift "just" adds the functionality to make the whole platform production-ready. I also like the approach of Red Hat to completely refactor OpenShift V2 to V3, taking into account what they have learned from older versions and not just simply trying to improve the old code base on top of Kubernetes and Docker.

  • Open development Development happens publically on GitHub: https://github.com/openshift/origin. OpenShift Origin is"the upstream open source version of Red Hat's distributed application system, OpenShift" per Red Hat.

  • Enterprise support available Many enterprises want to or need to have support contracts available for the software which they run their business upon. This is completely possible using the OpenShift Enterprise subscription which gets you commercial support from Red Hat.

  • Excellent documentation The documentation at https://docs.openshift.org/latest/welcome/index.html is very well structured, allowing for rapid identification of a topic youre seeking.

  • My favorite functions There are some functions which I like the most on OpenShift:

    • Application templates: Define all components and variables to run your application and then instantiate it very quickly multiple times with different parameters.

    • CLI: The CLI tool "oc" is very well structured and you get it very quickly how to work with it. It also has very good help instructions integrated, including some good examples.

    • Scaling: Scaling an application just takes one command to start new instances and automatically add them to the load balancer.

So why not chose Cloud Foundry? At the end of the day, everyone has their favourite tool for their own reasons. I personally found the learning curve for Cloud Foundry to be too steep. I didn’t manage to get an installation up and running with success. Also I had lots of trouble to understand the things around BOSH, a Cloud Foundry-specific configuration management implementation.

Quick Insight into OpenShift 3 - What does it look like?

OpenShift consists of these main components:

  • Master The API and Kubernetes Master / Scheduler

  • Nodes Runs pods, including the workload

  • Registry Hosts docker images

  • Services / Router Takes client requests and routes them to backend application containers. In a default configuration it’s a HAProxy load balancer, automatically managed by OpenShift.

For a deeper insight, consult the OpenShift Architecture

OpenShifts core is Kubernetes with additional functionality for application building and deployment made available to users and operators. So it’s very important to understand the concepts and the architecture of Kubernetes. Consult the official Kubernetes documentation to learn more: http://kubernetes.io/v1.1/

Communication between clients and the OpenShift control plane happens over REST APIs. The oc application, available via the OpenShift command-line client, gives access to all the frequently-used actions like deploying applications, creating projects, viewing statuses, etc.

Every API call must be authenticated. This authentication is also used to check if you’re authorized to execute the action. This authentication component allows for OpenShift to support multi-tenancy. Every OpenShift project has it’s own access rules. Projects are separate from each other. On the network side, they can be strictly isolated from each other via the ovs-multitenant network plugin. This means many users can share a single OpenShift platform without interfering each other.

Administrative tasks are done using oadm within the OpenShift command-line client. Example tasks involve operations such as deploying a router or a registry.

There is a helpful web interface which communicates to the master via the API and provides a graphical visualization of the cluster’s state.

Most of the tasks from the CLI can also be accomplished via the GUI.

To better understand OpenShift and its core-component Kubernetes, it’s important to understand some key terms:

  • Pod "In Kubernetes, all containers run inside pods. A pod can host a single container, or multiple cooperating containers". Roughly translated, this means that containers share the same IP address, the same Docker volumes and will run always on the same host.

  • Service A pod can offer services which can be consumed by other pods. Services are addressed by their name. This means for example a pod provides a HTTP service on the name "backend" on port 80. Another pod can now access this HTTP service by just addressing the namespace of “backend”. Services can be exposed externally from OpenShift using an OpenShift router.

  • Replication Controller A replication controller takes care of starting up a pod and keeping it running in the event of a node failure or any other disruptive event which could take a pod down. It is also responsible for creating replication pods in an effort to horizontally scale the lone pod.

Quickstart 3-node Origin Cluster on CentOS

There are a number of good instructions how to install OpenShift. This section will just give a very quick introduction to installing a 3-node (1 master, 2 nodes) OpenShift Origin cluster on CentOS 7.

If you want to know more details the OpenShift documentation at Installation and Configuration is quite helpful. The whole installation process is automated using Ansible, all playbooks are provided by the OpenShift project on Github. You also have the option to run an OpenShift master inside a Docker container, as a single binary or installing it from source. However the Ansible playbook is quite helpful for getting started.

Pre-requisites for this setup

  1. Three CentOS 7 64-Bit VMs prepared, each having 4+GB RAM, 2 vCPUs, 2 Disks attached (one for the OS, one for Docker storage). The master VM should have a third disk attached for the shared storage (exported by NFS in this example), mounted under /srv/data.

  2. Make sure you can access all the nodes from the master using SSH without a password. This is typically accomplished using ssh keys. The above user also needs sudo rights, typically via the NOPASSWD option in typical Ansible fashion.

  3. A wildcard DNS entry pointing to the IP address of the master. It is at this master where routers will run to allow for external clients to request application resources running within OpenShift.

  4. Read the following page carefully to make sure your VMs fit the needs of OpenShift: Installation Pre-requisites Pay special attention to the Host Preparation section.

  5. Ensure you have pyOpenSSL installed on the master node as it was a missing dependency during the time of writing this article. You can install it via yum -y install pyOpenSSL.

  6. Run all the following steps as your login user as opposed to root on the master node.

Setup OpenShift using Ansible

  1. Put the following lines into /etc/ansible/hosts. Update the values to fit your environment (hostnames):

    [OSEv3:children]
    masters
    nodes
    [OSEv3:vars]
    ansible_ssh_user=myuser
    ansible_sudo=true
    deployment_type=origin
    osm_default_subdomain=apps.example.com
    osm_default_node_selector='region=primary'
    openshift_master_identity_providers=[{'name': 'htpasswd_auth', 'login': 'true', 'challenge': 'true', 'kind': 'HTPasswdPasswordIdentityProvider', 'filename': '/etc/origin/htpasswd'}]
    [masters]
    originmaster.example.com
    [nodes]
    originmaster.example.com openshift_node_labels="{'region': 'infra', 'zone': 'dc1'}" openshift_schedulable=true
    originnode1.example.com openshift_node_labels="{'region': 'primary', 'zone': 'dc1'}" openshift_schedulable=true
    originnode2.example.com openshift_node_labels="{'region': 'primary', 'zone': 'dc1'}" openshift_schedulable=true

  2. Run Ansible: ansible-playbook playbooks/byo/config.yml

  3. Check that everything went well via the OpenShift client. Your output should show 3 nodes with STATUS ready: oc get nodes

  4. Add a user to OpenShift: sudo htpasswd /etc/origin/htpasswd myuser

  5. Deploy the registry (additional details at Deploy Registry):

    1. sudo htpasswd /etc/origin/htpasswd reguser

    2. oadm policy add-role-to-user system:registry reguser

    3. sudo oadm registry --mount-host=/srv/data/registry --credentials=/etc/origin/master/openshift-registry.kubeconfig --service-account=registry

  6. Deploy the router (additional details at Deploy Router):

    1. sudo oadm router --credentials=/etc/origin/master/openshift-router.kubeconfig --service-account=router

Add persistent storage

After these steps, one important piece is missing: Persistent storage. Running any application which stores application data will lose its data after migration to another OpenShift node after restarting, redeployment, and so on. Therefore we should add shared NFS storage. In our example, we will make this available by the master:

  1. Add the following line to /etc/exports: /srv/data/pv001 *(rw,sync,root_squash)

  2. Export the directory: sudo exportfs -a

  3. On all cluster nodes including the master, alter the SELinux policy in order to enable the usage of NFS: sudo setsebool -P virt_use_nfs 1

  4. Create a file called pv001.yaml with the following content:: apiVersion: "v1" kind: "PersistentVolume" metadata: name: "pv001" spec: capacity: storage: "30Gi" accessModes:

    • "ReadWriteOnce" nfs: path: "/srv/data/pv001" server: "originmaster.example.com" persistentVolumeReclaimPolicy: "Recycle"
  5. Create the definition from the template you just created: oc create -f pv001.yaml

  6. Check the definition: oc get pv

You now have a 3-node OpenShift Origin cluster including persistent storage, ready for your applications!

Please note: This is a very minimal setup. There are several things to do before running in production. F.e. you could add some constraints to make sure that the router and registry only run on the master and all applications on the nodes. Other things to include into production deployment considerations: storage capacity, network segmentation, security, accounts. Many of these topics are discussed in the official OpenShift documentation.

Deploy applications

Now that the 3-node cluster is up and running, we want to deploy apps! Of course, that’s the reason we created it in the first place, right? OpenShift comes with a bunch of application templates which can be used right away. Let’s start with a very simple Django with PostgreSQL example.

Before you begin, fork the original GitHub project of the Django example application to your personal GitHub account so that you’re able to make changes and trigger a rebuild. The intent here allows you to control webhook configurations for your fork to trigger code updates within OpenShift. Once done, then you can proceed to create the project within OpenShift.

  1. Login to https://originmaster.example.com:8443/ with the user created in step 4 above.

  2. Click on "New Project" and fill in all the fields. Name it myproject. After clicking on “Create” you’re directed to the overview of available templates.

  3. Create a new app by choosing the django-psql-example template

  4. Insert the repository URL of your forked Django example application into the field SOURCE_REPOSITORY_URL. All other fields can use their default value. By clicking on "Create" all required processes are started in the background automatically.

  5. The next page gives you some important hints. To have the complete magic: To automate the delivery of new code via a deployment without human intervention, configure the displayed webhook URL in your Github project. Now every time you push code to your git remote on GitHub, OpenShift gets notified and will rebuild and redeploy your app without effort spent by a human. Please note that you probably need to disable SSL verification as by default a self-signed certificate is used which would fail verification

  6. Watch your new app being built and deployed on the overview page. As soon as this is finished, the app is reachable at http://django-psql-example-myproject.apps.example.com/

  7. To get the feeling of the full automation: Change some code in the forked project and push it to GitHub. After a few seconds, reload the page and you should see your changes active.

Scaling

One of the most exciting features in OpenShift is scaling. Let’s say the above Django application is an online shop and you create some advertisement which will lead into more page views. Now you want to make sure that your online shop is available and responsive during this time. Simple as that:

oc get rc

oc scale rc django-psql-example-2 --replicas=4

oc get rc

The replication controller (rc) takes care of creating more Django backends on your behalf. Other components will make sure that these new backends are added to the router as load balancing backends. The replication controller also makes sure that there are always 4 replicas running, even if a host fails and there are enough hosts available on the cluster to run the workload on.

Scaling down is just as easy as scaling up, just adjust the --replicas= parameter accordingly.

Another application

Now that we’ve deployed and scaled a default app, we want to deploy a more customized app. Let’s use Drupal 8 as an example.

Drupal is a PHP application which uses MySQL by default, so we need to use the matching environment for this. Set it up via the following command:

oc new-project drupal8

oc new-app php~https://github.com/tobru/drupal-openshift.git#openshift \

mysql --group=php+mysql -e MYSQL_USER=drupal -e \

MYSQL_PASSWORD=drupalPW -e MYSQL_DATABASE=drupal

This long command needs a bit of explanation:

  • oc: Name of the command line OpenShift client

  • new-app: Subcommand to create a new application in OpenShift

  • php~: Specifies the build container to use (if not provided the S2I process tries to find out the correct one to use)

  • https://github.com/tobru/drupal-openshift.git: Path to the git repository with the app source to clone and use

  • #openshift: Git reference to use. In this case the openshift branch

  • mysql: Another application to use, in this case a MySQL container

  • –group=php+mysql: Group the two applications together in a Pod

  • -e: Environment variables to use during container runtime

The new-app command uses some special sauce to determine what build strategy it should use. If there is a Dockerfile present in the root of the cloned repository, it will build a Docker image accordingly. If there is no Dockerfile available, it tries to find out the project’s language and uses the Source-to-Image (S2I) process to build a matching Docker image containing both the application runtime and the application code.

In the example above we specify to use a PHP application container and a MySQL container to group them together in a pod. To successfully execute the MySQL container a few environment variables are needed.

After the application has been built, the service can be exposed to the world:

oc expose service drupal-openshift --hostname='drupal8.apps.example.com'

As the application repository is not perfect and the PHP image not configured correctly for Drupal (perhaps we hit the issue #73!), we need to run a small command inside the pod to complete the Drupal installation. Substitute ID with the ID of your running pod which is visible via oc get pods):

oc exec drupal-openshift-1-ID php composer.phar install

Now navigate to the URL drupal8.apps.example.com and run the installation wizard. You’ll want to set the DB host to "127.0.0.1" as “localhost” doesn’t work as you might expect.

At the end there is still a lot to do to get a "perfect" production-grade Drupal instance up and running. For example it is probably not a good idea to run the application and database in the same pod because it makes scaling difficult. Scaling a pod up scales all Docker images contained within the pod. This means that the database image also needs to know how to scale, which is not the default case. In it’s heart, scaling means just spinning up another instance of a Docker image, but that does not mean that the user generated data is automatically available to the additional running Docker images. This needs some more effort put in. The best thing here would be to have different pods for the different software types: One pod for the Drupal instance and one pod for the database so that they can be scaled independently and the task of replicating user generated data can be done tailored to the softwares need (which is of course differently between a web server and a database server).

Also there is persistent storage missing in this example. Every uploaded file or other working files will be lost when the pod is restarted. If you want more information on how to most effectively add persistent storage, here is a very good blog post describing it in detail: OpenShift v3: Unlocking the Power of Persistent Storage.

Helpful commands

When working with OpenShift, it’s useful to have some commands ready that help getting information or show what is going on.

OpenShift CLI: oc

The OpenShift CLI "oc" can be installed on your computer, see Get Started with the CLI. Before issuing an oc command, you must login to the OpenShift master with oc login. It will ask for an URL to the master (if started for the first time) and for a username and password.

  • oc whoami
    If you can’t remember who you are, this tells it to you.

  • oc project $NAME
    Shows the currently active project to which all commands are run against. If a project ame is added to the command then the currently active project changes.

  • oc get projects
    Displays a list of projects to which the current user has access to

  • oc status
    Status overview of the current project

  • oc describe $TYPE $NAME
    Detailed information about an object.oc describe pod drupal-openshift-1-m3uvx

  • oc get event
    Shows all events in the current project. Very useful for finding out what happened.

  • oc logs [-f] $PODNAME
    Show the logs of a running pod. With -f it tails the log much like tail -f.

  • oc get pod [-w]
    List of pods in the current project. With -w it shows changes in pods. Note: watch oc get pod is a helpful way to watch for pod changes

  • oc rsh $PODNAME
    Start a remote shell in the running pod to execute commands

  • oc exec $PODNAME $COMMAND
    Execute a command in the running pod. The command’s output is sent to your shell.

  • oc delete events --all
    Cleanup all events. Useful if there are a lot of old events. Events are information about what is going on on the API objects and what problems exist (if there are any).

  • oc get builds
    List of builds. A build is a process of creating runnable images to be used on OpenShift.

  • oc logs build/$BUILDID
    Build log of the build with the id "buildid". This corresponds to the list of builds which are displayed with the command above.

Commands to run on the OpenShift server

The OpenShift processes are managed by systemd. All logs are written to the systemd journal. So the easiest way to get information about what is going on it to query the system journal:

  • sudo journalctl -f -l -u docker
    System logs of Docker

  • sudo journalctl -f -l -u origin-master
    System logs of Origin Master

  • sudo journalctl -f -l -u origin-node
    System logs of Origin Node

Some more interesting details

Router

The default router runs HAproxy which is dynamically reconfigured should new services be requested to be routed by the OpenShift client. It also exposes its statistics on the router's IP address over TCP port 1936. The password to retrieve this is shown during the application’s deployment or it can be retrieved by running oc exec router-1- cat /var/lib/haproxy/conf/haproxy.config | less. Look for a line beginning with "stats auth".

Note: for some reasons an iptables rule was missing on my master node preventing my getting at the router statistics. I added one manually to overcome via sudo iptables -A OS_FIREWALL_ALLOW -p tcp -m state --state NEW -m tcp --dport 1936 -j ACCEPT

Logging

OpenShift brings a modified ELK (Elasticsearch-Logstash-Kibana) stack called EFK: Elasticsearch-FluentD-Kibana. Deployment is done using some templates and the OpenShift workflows. Detailed instructions can be found at Aggregating Container Logs in the OpenShift documentation. When correctly installed and configured as described under the above link, it integrates nicely with the web interface. These steps are not part of the Ansible playbooks and need to be carried out manually.

Metrics

Kubernetes Kubelets gather metrics from running pods. To collect all these metrics, the metric component needs to be deployed similar to the logging component via OpenShift workflows. This is also very well documented at Enabling Cluster Metrics in the OpenShift documentation. It integrates into the web interface fairly seamlessly..

Failover IPs

Creating a highly available service most of the time involves having IP addresses be made highly available. If you want to have a HA router, there is the concept of IP failover available within OpenShift. This means you configure an IP address as a failover address and attach it to a service. Under the hood, keepalived now keeps track of this IP and makes it highly available using the VRRP protocol.

IPv6

I couldn’t find much information about the state of IPv6 in OpenShift. But it seems problematic right now, as far is I can see. Docker is supporting IPv6 but Kubernetes seems to lack functionality: Kubernetes issue #1443

Lessons learned so far

During the last few months while making myself familiar with OpenShift I’ve learned that the following points are very important in understanding OpenShift:

  • Learn Kubernetes This is the main building block in OpenShift, so a good knowledge is necessary to get around the concepts of OpenShift.

  • Learn Docker As this is the second main building block of OpenShift, it’s also important to know how it works and what concepts it follows.

  • Learn Twelve-Factor To get the most out of a PaaS, deployed applications should closely follow the Twelve-Factor document.

Some other points I learned during experimenting with OpenShift:

  • The Ansible playbook is a fast moving target. Most of the time the paths written in the documentation don’t match the Ansible code sadly. Also some things didn’t work well, for example upgrading from Origin 1.0.8 to Origin 1.1.0.

  • OpenShift heavily depends on some features, such as SELinux, which are by default only present on Red Hat-based Linux distributions. This makes it hard to go about getting OpenShift working on Ubuntu-based Linux distributions without things quickly becoming a yak shaving exercise. In theory it should be possible to run OpenShift on all distributions supporting Docker and Kubernetes, but as always the devil lies in the details.

  • Proper preparation is the key to success. As OpenShift is a complex system, preparation helps to get a working system. This is not only preparing VMs and IP addresses, but also preparing knowledge, like learning how everything works and try it out in a test system.

Some more technical learnings:

  • When redeploying the registry the master needs to be restarted, as the master caches the registry service IP. This is possible via: sudo systemctl restart origin-master

  • Before running applications on OpenShift it makes sense to run the diagnostics tool using: sudo openshift ex diagnostics

Automate all the things!

The friendly people at Puzzle are working on a Puppet module to make the OpenShift installation and configuration as automated as possible. Internally it calls Ansible to do all the lifting. While it doesn’t make sense to re-implement everything in Puppet, the module helps with manual tasks that have to be carried out after having OpenShift installed by Ansible. For an already existing Puppet environment, this is great to get OpenShift integrated.

You can find the source on GitHub and help to make it even better: puzzle/puppet-openshift3.

Conclusion and Thanks

This blog post only touches the tip of the iceberg regarding OpenShift and its capabilities as an on-premise PaaS. It would need many books to cover all of this very exciting technology. For me it’s one of the most thrilling piece of technology since many years and I’m sure it will have a bright future!

If you are interested in running OpenShift in production, I suggest doing a proof-of-concept fairly early. Be prepared to read and plan a lot. Many important topics such as monitoring, security, backup were not covered here and are important topics for a production-ready PaaS

For those wanting additional reading materials on OpenShift, here are some additional links with lots of information:

I want to thank everyone who helped me with this blog, especially my workmates at VSHN (pronounced like vision / vĭzh'ən) and our friends at Puzzle ITC. And another special thank goes to Nick Silkey (@filler) for being the editor of this article.

If you have any comments, suggestions or if you want to discuss more about OpenShift and the PaaS topic, you can find me on Twitter @tobruzh or on my personal techblog called tobrunet.ch.