Showing posts with label network. Show all posts

December 19, 2017

Day 19 - Infrastructure Testing: Sanity Checking VPC Routes

By: Dan Stark (@danstarkdevops)
Edited By: James Wen

Testing Infrastructure is hard; testing VPCs is even harder

Infrastructure testing is hard. My entire career I’ve tried to bring traditional development testing practices into operations. Linters. Rspec. Mock objects. These tools provide semantic and syntax checking, as well as unit and integration level coverage for infrastructure as code. Ideally, we would also test the system after the code is deployed. End-to-end infrastructure testing has always been a stretch goal – too time-consuming to implement from scratch. This is especially true of network level testing. I am not aware of any existing tools that provide self-contained, end-to-end tests to ensure VPCs, subnets, and route tables are properly configured. As a result, production network deployments can be incredibly anxiety-inducing. Recently, my coworkers and I set up an entire VPC (virtual private cloud) using infrastructure as code, but felt we needed a tool that could perform a VPC specification validation to catch bugs or typos before deployment. The goal was to sanity check our VPC routes using a real resource in every subnet.

Why is this necessary

A typical VPC architecture may contain multiple VPCs and include peering, internal/external subnets, NAT instances/gateways, and internet gateways. In the “Reliability Pillar” of their “Well-Architected Framework” whitepaper, AWS recommends designing your system based on your availability need. At Element 84, we desired 99.9% reliability for EC2, which required 3 external and internal subnets having CIDR blocks of /20 or smaller. In addition, we needed 9 of these redundant VPCs to provide required network segregation. It took significant effort to carve out VPCs with dependent rules and resources for three availability zones.

Here is a hypothetical example of multiple VPCs (Dev, Stage, Prod) over two regions:
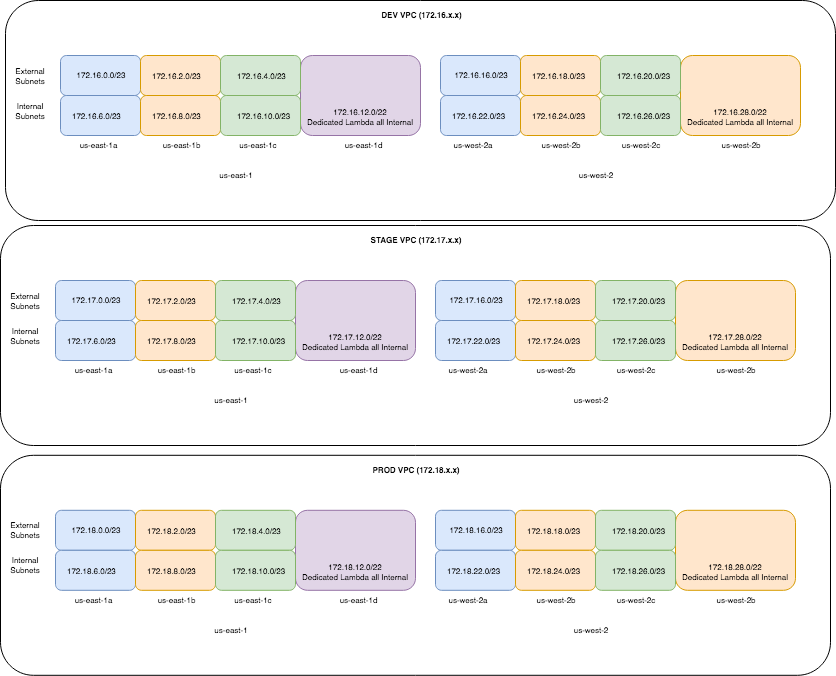
image1

Extending this example with additional VPCs for bastion hosts, reporting, and Demilitarized Zones for contractors (DMZs), both NonProd and Prod:

image 2

It’s too easy for a human to make a mistake, even with infrastructure as code.

Managing VPC infrastructure

Here’s one example of how we want a VPC to behave:

We want a Utility VPC peered to a Staging VPC. The Utility VPC contains bastion EC2 instances living in external subnets and the Staging VPC contains internally subnetted application EC2 instances. We want to test and ensure the connectivity between these resources. Also, we want to verify that every bastion EC2 can communicate with all the potential application EC2 instances, across all subnets. Additionally, we want to test connectivity to the external internet for the application EC2 instances, in this case via a NAT gateway.

These behaviors are well defined and should be tested. We decided to write a tool to help manage testing our VPCs and ensuring these kinds of behaviors. It contains:

  1. a maintainable top level DSL written in YAML to declare the VPC specification that sits above the VPC configuration code; and
  2. a mechanism to be able to test the network level connectivity between VPCs, subnets, IGW/NAT and report any problems.

Introducing: VpcSpecValidator

This project is “VpcSpecValidator,” a Python 3 library built on top of the boto3.

There are a few requirements in how you deploy your VPCs to use this library:

  1. You must have deployed your VPCs with CloudFormation and have Outputs for internal subnet with the strings “Private” or “Public” and “Subnet”, e.g. “DevPrivateSubnetAZ1A”, “DevPrivateSubnetAZ1B”, “DevPrivateSubnetAZ1C.”
  2. All VPCs should be tagged with ‘Name’ tags in your region(s).
  3. You must ensure your that a security group attached to these instances allows SSH access between your VPC peers. This is not recommended for production so you may want to remove these rules after testing.
  4. You must have permissions to create/destroy EC2 instances for complete setup and teardown. The destroy method has multiple guards to prevent you from accidentally deleting EC2 instances not created by this project.

You supply a YAML configuration file to outline your VPCs’ structure. Using our example above, this would look like:

project_name: mycompany
region: us-east-1
availability_zones:
  - us-east-1a
  - us-east-1b
  - us-east-1c

# Environment specification
dev:
  peers:
    - nonprod-util
    - nonprod-reporting
  us-east-1a:
    public: 172.16.0.0/23
    private: 172.16.6.0/23
  us-east-1b:
    public: 172.16.2.0/23
    private: 172.16.8.0/23
  us-east-1c:
    public: 172.16.4.0/23
    private: 172.16.10.0/23

stage:
  peers:
    - nonprod-util
    - nonprod-reporting
  us-east-1a:
    public: 172.17.0.0/23
    private: 172.17.6.0/23
  us-east-1b:
    public: 172.17.2.0/23
    private: 172.17.8.0/23
  us-east-1c:
    public: 172.17.4.0/23
    private: 172.17.10.0/23

nonprod-util:
  peers:
    - dev
    - stage
  us-east-1a:
    public: 172.19.0.0/23
    private: 172.19.6.0/23
  us-east-1b:
    public: 172.19.2.0/23
    private: 172.19.8.0/23
  us-east-1c:
    public: 172.19.4.0/23
    private: 172.19.10.0/23

nonprod-reporting:
  peers:
    - dev
    - stage
  us-east-1a:
    public: 172.20.0.0/23
    private: 172.20.6.0/23
  us-east-1b:
    public: 172.20.2.0/23
    private: 172.20.8.0/23
  us-east-1c:
    public: 172.20.4.0/23
    private: 172.20.10.0/23

prod:
  peers:
    - prod-util
  us-east-1a:
    public: 172.18.0.0/23
    private: 172.18.6.0/23
  us-east-1b:
    public: 172.18.2.0/23
    private: 172.18.8.0/23
  us-east-1c:
    public: 172.18.4.0/23
    private: 172.18.10.0/23

prod-util:
  peers:
    - prod
  us-east-1a:
    public: 172.19.208.0/23
    private: 172.19.214.0/23
  us-east-1b:
    public: 172.19.210.0/23
    private: 172.19.216.0/23
  us-east-1c:
    public: 172.19.212.0/23
    private: 172.19.218.0/23

prod-reporting:
  peers:
    - prod
  us-east-1a:
    public: 172.20.208.0/23
    private: 172.20.214.0/23
  us-east-1b:
    public: 172.20.210.0/23
    private: 172.20.216.0/23
  us-east-1c:
    public: 172.20.212.0/23
    private: 172.20.218.0/23

The code will:

  1. parse the YAML for a user-specified VPC,
  2. get the public or private subnets associated with each Availability Zone’s CIDR range in that VPC,
  3. launch an instance in those subnets,
  4. identify the peering VPC(s),
  5. create a list of the test instances in the peer’s subnets (public or private, depending on what was specified in step 2),
  6. attempt an TCP socket connection using the private IP and port 22 for each instance in this list.

Step 5 posed an interesting deployment challenge. We decided UserData was a good option to bootstrap and clone the repo on an EC2 instance, but did not know how to pass it peered VPC’s private IP addresses as SSH targets.

Given the entire specification is in one file and the CIDR ranges are available, we can cheat and look at the Outputs of the peer(s)’ CloudFormation stack and see if any instances created in Step 3 match.

def get_ip_of_peer_instances_and_write_to_settings_file(self):

    '''
    This is run on the source EC2 instance as part of UserData bootstrapping
    1) Look at the peer(s)' VPC CloudFormation Stack's Outputs for a list of subnets, public or private as defined in the constructor.
    2) Find instances in those subnets created by this library
    3) Get the Private IP address of target instances and write it to a local configuration file
    '''
        
    # Query for peer CloudFormation, get instances
    target_subnet_list = []
    target_ip_list = []
    with open(self.config_file_path, 'r') as ymlfile:
        cfg = yaml.load(ymlfile)
    
    for peer in self.peers_list:
        peer_stack_name = "{}-vpc-{}-{}".format(self.project_name, peer, cfg['region'])
    
        # Look at each peer's CloudFormation Stack Outputs and get a list of subnets (public or private)
        client = boto3.client('cloudformation')
        response = client.describe_stacks(StackName=peer_stack_name)
        response_outputs = response['Stacks'][0]['Outputs']
    
        for i in range(0,len(response_outputs)):
            if self.subnet_type == 'public':
                if 'Subnet' in response_outputs[i]['OutputKey'] and 'Public' in \
                        response_outputs[i]['OutputKey']:
                    subnet_id = response_outputs[i]['OutputValue']
                    target_subnet_list.append(subnet_id)
    
            else:
                if 'Subnet' in response_outputs[i]['OutputKey'] and 'Private' in \
                        response_outputs[i]['OutputKey']:
                    subnet_id = response_outputs[i]['OutputValue']
                    target_subnet_list.append(subnet_id)
    
    
        # Search the instances in the targeted subnets for a Name tag of VpcSpecValidator
        client = boto3.client('ec2')
        describe_response = client.describe_instances(
            Filters=[{
                'Name': 'tag:Name',
                'Values': ['VpcSpecValidator-test-runner-{}-*'.format(peer)]
            }]
        )
    
        # Get Private IP addresses of these instances and write them to target_ip_list.settings
    
        for i in range(0,len(describe_response['Reservations'])):
            target_ip_list.append(describe_response['Reservations'][i]['Instances'][0]['PrivateIpAddress'])
    
        # Write the list to a configuration file used at runtime for EC2 instance
        with open('config/env_settings/target_ip_list.settings', 'w') as settings_file:
            settings_file.write(str(target_ip_list))

There is also a friendly method to ensure that the YAML specification matches what is actually deployed via CloudFormation templates.

spec = VpcSpecValidator('dev', subnet_type='private')

spec.does_spec_match_cloudformation()

Next Steps

At Element 84, we believe our work benefits our world, and open source is one way to personify this value. We’re in the process of open sourcing this library at the moment. Please check back soon and we’ll update this blog post with a link. We will also post a link to the repo on our company Twitter.

Future features we would like to add:

  • Make the VpcSpecValidator integration/usage requirements less strict.
  • Add methods to test internet connectivity.
  • Dynamic EC2 keypair generation/destruction. The key pairs should be unique and throwaway after the test.
  • Compatibility with Terraform.
  • CI as a first-class citizen by aggregating results in JUnit-compatible format. Although I think it would be overkill to run these tests with every application code commit, it may make sense for infrastructure commits or running on a schedule.

Wrap Up - Testing VPCs is difficult but important

Many businesses use one big, poorly defined (default) VPC. There are a few problems with this:

Development resources can impact production

At a fundamental level, you want to have as many barriers between development and production environments as possible. This isn’t necessarily to stop developers from caring about production. As an operator, I want to prevent my developers from being in a position where they might unintentionally impact production. In addition to security group restrictions, avoid these potential mishaps impossible from a network perspective. To steal an idea from Google Cloud Platform, we want to establish "layers of security.” This tool helps to enforce these paradigms by validating VPC behavior prior to deployment.

Well-defined and well-tested architecture is necessary for scaling

This exercise forced our team to think about our architecture and its future. What are the dependencies as they sit today? How would we scale to multi-region? What about third party access? We would want them in a DMZ yet still able to get the information they need. How big do we expect these VPCs to scale?

It’s critical to catch these issues before anything is deployed

The best time to find typos, configuration, and logic errors is before the networking is in use. Once deployed, these are hard errors to troubleshoot because of the built-in redundancy. The goal is to prevent autoscaling events yielding a “how was this ever working” alarm at 3AM because one subnet route table is misconfigured. That’s why we feel a tool like this has a place in the community. Feel free to add comments and voice a +1 in support.

Happy SysAdvent!

December 13, 2017

Day 13 - Half-Dead TCP Connections and Why Heartbeats Matter

By: Alejandro Brito Monedero (@ae_bm)

Edited By: J. Paul Reed (@jpaulreed)

We are living interesting times in the tech world, full of trendy technologies, like cloud computing, containers, schedulers, and serverless.

They’re all rainbows and unicorns when they work. But we can start to forget about the systems that support our abstractions until they break, and we have to give our best to fix them.

Some time ago in one of our multiple pub-sub systems, there were some processes publishing messages to a message broker. Those messages are consumed by a process running in a container. So far this isn’t too exotic; it’s easy to diagram out:

Pub Sub

For the most part, this system worked as expected. However, at one point, we received some alerts from the monitoring system. Those alerts reported that the broker had a lot of queued messages and no consumers connected. Our first reaction was to restart the consumer container and call it a day. But the error kept happening, always at the worst possible time.

While taking a closer look at the problem, we confirmed that the broker has no consumers to deliver the messages. The surprise came when we inspect the consumer container. It was still running and seemingly all was well, except we did notice it was blocked on the socket used to communicate with the broker. When we inspect the socket statistics inside the container’s network namespace, it showed a connection to the broker:

# ss -tpno
ESTAB      0      0               <container ip>:<some port>         <broker ip>:<broker port>

Upon seeing this, our reaction could pretty much be summed up as:

The problem seemed to be that the connection state between the broker and consumer was not synchronized. In the host network namespace (where the broker is running), the status showed there weren’t any TCP connection from the container. Instead in the container network namespace there is an established connection to the broker. Our dear RFC 793 mentions this situation Half-Open Connections and Other Anomalies (emphases mine):

An established connection is said to be “half-open” if one of the TCPs has closed or aborted the connection at its end without the knowledge of the other, or if the two ends of the connection have become desynchronized owing to a crash that resulted in loss of memory. Such connections will automatically become reset if an attempt is made to send data in either direction. However, half-open connections are expected to be unusual, and the recovery procedure is mildly involved.

If at site A the connection no longer exists, then an attempt by the user at site B to send any data on it will result in the site B TCP receiving a reset control message. Such a message indicates to the site B TCP that something is wrong, and it is expected to abort the connection.

After that nice enlightenment, we started to think of possible causes for that “desynchronization.” Options that came to mind included:

  • the broker restarting or crashing
  • man-in-the-middle attack (MITM)
  • A grumpy kernel (iptables, ebtables, bridges, etc)
  • A grumpy container engine
  • Some Lovecraftian horror show

To determine which it was, we first checked if the broker has crashed or has been restarted. Upon inspection, we found it’d been running for a long time and other systems using it were working normally. So it wasn’t a problem with the broker.

The kernel iptables and bridge didn’t show anything weird. A MITM attack seemed a bit exotic. The other options were hard to prove, and we thought it wouldn’t be very professional of us to blame the container system without any evidence. ;-)

While trying to think of other causes it could be, we kept tcpdump running on one of consumer containers. tcpdump captured an RST message sent from the container IP to the broker in response to the broker sending a data message to the consumer container after a long period of inactivity. The weird thing is that network traffic never reached the container, neither the RST originated from the container. Maybe the MITM attack wasn’t such an exotic possibility after all?!

Meanwhile, while trying to re-create the problem end state and work toward making our our systems resilient to this situation: we used iptables to drop or reset traffic from the broker to the container after the container connected to the broker. Both methods allowed us to observe the same end-state we were getting in production, confirming the container never learns that the broker connection is lost. Figuring out how to find how to learn that your peer is down even if the TCP connection state is established proved difficult. But after some Internet searching, we found RFC 1122’s section on TCP Keep-Alives (again emphases mine):

Implementors MAY include “keep-alives” in their TCP implementations, although this practice is not universally accepted. If keep-alives are included, the application MUST be able to turn them on or off for each TCP connection, and they MUST default to off.

Keep-alive packets MUST only be sent when no data or acknowledgement packets have been received for the connection within an interval*. This interval MUST be configurable and MUST default to no less than two hours.

DISCUSSION:

A “keep-alive” mechanism periodically probes the other end of a connection when the connection is otherwise idle, even when there is no data to be sent. The TCP specification does not include a keep-alive mechanism because it could:
(1) cause perfectly good connections to break during transient Internet failures; (2) consume unnecessary bandwidth (“if no one is using the connection, who cares if it is still good?”); and (3) cost money for an Internet path that charges for packets.

A TCP keep-alive mechanism should only be invoked in server applications that might otherwise hang indefinitely and consume resources unnecessarily if a client crashes or aborts a connection during a network failure.

Translation: distributed systems are fun… and determining whether a connection is still valid is often the cherry on top.

But before trying to poke at the TCP stack, we kept investigating. We found out that AMQP supports heartbeats, and they are used to check if a connection is still valid. The library we were using had this option disabled by default, which explains why the container was blocked and waiting instead of trying to reconnect to the broker. To make things worse because the container is a consumer, it never sends data to the broker. If the container has sent data using the same socket it could detect on its own whether the connection was still valid.

To fix this, we evaluated two solutions:

  • The TCP keep-alive fix was the fastest to implement, but we didn’t like it because it deletgated detection of the broken connection to the kernel TCP implementation. Also we didn’t really want to mess with kernel socket options.
  • For an alternative, we ran some tests with other applications and they handled it at the application level (thank you Bandwagon effect). Through this testing, we found we could change the library to activate the AMQP heartbeats. It took more time, but it felt like a better solution to use the mechanisms provided by the AMQP protocol.

But what about the MITM attack we thought we were seeing?

First some context: we run periodic, short-lived helper containers. We have observed with tcpdump that when a container starts, it announces some ICMPv6 memberships. Also by default, the container network namespace is attached to a network bridge. The network bridge uses a cache to associate addresses with its respective port, like a network switch. It populates this table when it sees network traffic; as you might imagine, if there isn’t any traffic for some time, the data in the table becomes stale.

The MITM “attack” happens when in a period without traffic between the broker and the container, the bridge cache is stale and a short live container is launched, there is a chance for it to get the same IP address the consumer container has. This new container changes the bridge cache, then if the broker sends a message to the consumer, the bridge delivers it to the new container, who then answers with a TCP RST because it doesn’t have a TCP connection with the broker. Finally the broker receives the TCP RST and aborts its connection with the consumer. The magic of giving the same IP address to different containers.

A picture is worth a thousand words.

Without the MITM

With the MITM

Ultimately, the problem turned out to be one of the most exotic possibilities we had come up with, making us feel pretty:

Conclusion

Our programs must be prepared to handle network disruptions even when the network traffic doesn’t leave a single host and you are using containers. Remember: the network is not reliable! If we forget this, we will have a lot of “fun” with distributed systems bugs.

Perhaps more importantly: always remember that if your program never sends traffic on its TCP socket, you can’t be sure whether the connection is valid or if you will end up waiting for a message that will never arrive.

There are two solutions to avoid this situation: the first is to use TCP keepalives and delegate detection of stale connections to the OS; The other is to implement or use a heartbeat mechanism at a higher layer in the protocol.

Both alternatives have their pros and cons, so you’ll need to find which one is best for your team and hte distributed system you run. But now that you’ve seen a story where TCP half-open connections, “anomelies,” and keep-alives all worked together, you’ll know that MITM “attack” might not be such an exotic cause of the problem, even if it’s not an attacker trying to get in, but rather your own the kernel.

Extras

While preparing this post, I found this article, which discusses half open connections; it would have been handy when explaining this problem to my coworkers.

December 20, 2015

Day 20 - Why NetDevOps?

Written by: Leslie Carr (@lesliegeek)
Edited by: Brian Henerey (@bhenerey)

We’ve read a lot of great ideas so far. However one crucial piece is missing in these conversations - the network!

Automation has moved from a new idea to something we take for granted in the new DevOps paradigm. For too long the network has been left behind from this awesome paradise and has been left to suffer in the dark days of manual configurations. Some engineers think that this is because network engineers simply don’t care about modernizing their ways, but this is not true for many! The truth is that tools to interact with switches and routers are still in their infancy. Cisco’s OnePK, which created an API for Cisco switches and routers, was only released to the general public in early 2014! CFEngine began in 1993! The systems world has had over 20 years of a head start over the network world! There has been much debate over why this lag has occurred, but I am not going to jump into the middle of that. Today I am going to tell you how to bridge this gap.

Collaboration

The fact that network teams deal with the world in a different manner than systems teams is not only a technological problem. These differences prevent easy collaboration. Systems and network teams are often divided with ticket walls in between silos. In many companies this causes friction or even hostility in between teams, instead of promoting empathy and collaboration. As an example, take new system setup. The network team has to configure ports and assign vlans. The systems team has to turn up the machine and get it running in its proper roles. In a better world, one team could just send a pull request over to the other and it would be a quick review. In a normal company, a ticket is opened. The network team has more urgent and interesting tasks to do than port configuration. The systems team is waiting, feeling helpless and frustrated. Resentment builds up instead of harmony and cooperation!

Software

Rancid has been the one and only way to deal with gathering network configurations. It’s not a bad tool - it works with almost everything. The problem is that Rancid deals with the world through the lens of an older paradigm. Rancid logs into network gear with passwords stored in plain text and then uses expect scripts to basically screen scrape data and push it into a CVS or SVN repository.

The network teams do not have to reinvent the wheel and can use the same software that the systems teams use. The popular configuration tools, like Chef, Puppet, Ansible, and Salt are starting to interact with switches and routers. The bad news is that these tools often only configure a subset of the possible configuration options and only work on a few models of switches. While we wait for all of our gear to be easily supported, the network world needs to take some intermediate steps to move towards the standard future.

The DevOps movement has evolved the systems world to one where infrastructure is defined by code, with all of the benefits involved. The network world needs to join up, with NetDevOps.

Templatize configurations

Many switches and routers still don’t support automation tools. As well, most switches share the same basic configurations, with ports and IP addresses as changing variables. We can use our automation tools and templates to automatically output configurations.

Tear down the ticket wall

Now that your configurations are code, you can use git pull requests for all of those little things you used to ticket. Breaking down the ticket wall in between team silos improves everyone’s productivity and empathy. Spotify calls this an internal open source model and uses it to help make their company so successful.

Code Reviews

Now that all changes are via pull requests, you can use tools to enforce that requirement and code reviews by a second person. If you are not using version control software to centralize and change your configurations, code reviews are only possible by someone looking over another person’s shoulder before they hit enter. Continuous integration tools like Jenkins and Travis CI aren’t just for code. You can write tests to check syntax or for spelling errors! Typos have brought down most major websites at some point in time (http://www.cnet.com/news/widespread-google-outages-rattle-users/). Computers are so much better at catching these mistakes than humans.

Testing

Virtualization and test environments aren’t just for servers any more. And you don’t need to buy an entire second set of hardware just to test out your changes. GNS3 is a great, open source tool that has VM support for most major vendor platforms. You can make a model of your network and test out that BGP change before your 3am maintenance window. No more “I’m pretty sure this will work in production!”

The future starts with you

If you want your networking equipment to support automation clients directly, the best thing you can do is to pressure your sales people. Until about a month ago I was working for a vendor and a large amount of feature prioritization is based on customer demand and feedback (these are for-profit corporations, after all!). We’re not in the old fashioned world where Cisco can dictate how your network is run. There are so many choices nowadays. If we demand that the network vendors help us to run the networks just like we run our servers, they will listen because we can vote with our wallets.

Hopefully soon, we’ll tell the stories of how we used to login to a router via telnet and type commands directly on the command line like a ghost story, to scare the new junior admins around the campfire!

December 11, 2014

Day 11 - Turning off the Pacemaker: Load Balancing Across Layer 3

Written by: Jan Ivar Beddari (@beddari)
Edited by: Joseph Kern (@josephkern)

Introduction

Traditional load balancing usually brings to mind a dedicated array of Layer 2 devices connected to a server farm, with all of the devices preferably coming from the same vendor. But the latest techniques in load balancing are being implemented as open source software and standards driven Layer 3 protocols. Building new load balancing stacks away from the traditional (often vendor controlled) Layer 2 technologies opens up the network edge and creates a flexible multi-vendor approach to systems design that many small organizations are embracing and leaves many larger organizations wondering why they should care.

Layer 2 is deprecated!

The data center network as a concept is changing. The traditional three layer design model - access, aggregation and core - is being challenged by simpler, more cost effective models where internet proven technology is reused inside the data center. Today, building or redesigning a data center network for modern workloads would likely include running Layer 3 and routing protocols all the way down to the top-of-rack (ToR) switches. Once that is done, there is no need for Layer 2 between more than two adjacent devices. As a result, each and every ToR interface would be a point-to-point IP subnet with its own minimal broadcast domain. Conceptually it could look something like this:

layer 3 only-network

Removing Layer 2 from the design process and accepting Layer 3 protocols and routing appears to be the future for networks and service design. This can be a hard transition if you work in a more traditional environment. Security, deployment practices, management and monitoring tools, and a lot of small details need to change when your design process removes Layer 2. One of those design details that need special consideration is load balancing.

Debating the HAProxy single point of failure

Every team or project that has deployed HAproxy has had a conversation about load balancing and resiliencey. These converstaions often start with the high ideal of eliminating single points of failure (SPoF) and end with an odd feeling that we might be traiding one SPoF for another. A note: I’m not a purist, I tend to casually mix the concept of load balancing with that of achieving basic network resilience. Apologies in advance about my lack of formality, practical experience suggests that dealing with these concepts separately does less to actually solve problems. How then do we deploy HAProxy for maximum value with the least ammount of effort in this new Layer 3 environment?

The simplest solution, and possibly my favorite one, would be to not bother with any failover for HAProxy at all. HAProxy is an incredible software engineering effort and given stable hardware it will just run, run and run. HAProxy will work, there will be no magic happening, if you reboot the node where it runs or have any kind of downtime - your services will be down. As excpected. That’s the point, you know what to expect and you will get exactly that. I think we sometimes underestimate the importance of making critical pieces of infrastructure as simple as possible. If you know why and at what cost metrics, just accepting that your HAProxy is and will be a SPoF can be your best bet.

Good design practice: Always question situations where a service must run without a transparent failover mechanism. Is this appropriate? Do I understand the risk? Have the people that depend on this service understood and accepted this risk?

But providing failover for a HAProxy service isn’t trivial. Is it even worth implementing? Maybe using Pacemaker or keepalived to cluster the HAProxy will work? Or might there be better alternatives that have been created while you are reading this post?

Let’s say that for the longest time you did run your HAProxy as a SPoF and it worked very well, it was never overloaded, whatever downtime experienced wasn’t related to the load balancer. But then someone decides that all parts and components in your service have to be designed with a realtime failover capability. With a background in development or operations, I think most people would default to start building a solution on proven software like Pacemaker or keepalived. Pacemaker is a widely used cluster resource management tool that covers a wide array of use cases around running and operating software clusters. keepalived design is simpler and with less features, relying on Virtual Router Redundancy Protocol (VRRP) for IP based failover. Given how services are evolving towards Layer 3 mechanisms, using any of these tools might not be the best decision. Pacemaker and keepalived in their default configurations rely on moving a virtual IP adress (VIP) inside a single subnet. They just will not work in a modern data center without providing legacy Layer 2 broadcast domains as exceptions to the Layer 3 design.

But the Layer 2 broadcast domain requirement of Pacemaker and keepalived are limitations that can be ignored or worked around. Ignoring it would involve doing things like placing VIP resources inside an “availability-stretched” overlay network, e.g inside a Openstack tenant network or a subnet inside a single Amazon availability zone. This is a horrible idea. Not only does this build a critical path on top of services not really designed for that, it would also not achieve anything beyond the capabilites of a single HAProxy instance. When it comes to workarounds, keepalived could allow VRRP unicast to be routed, thus “escaping” the single subnet limitation. Pacemaker uses a VIPArip resource that allows management of IP aliases across different subnets. I don’t think these designs would make enough sense (i.e. be simple enough) to design a solution around. Working around a single broadcast domain limitation by definition would involve modifying your existing Layer 3 routing, better value exists eslewhere.

Solving the HAProxy SPoF problem

Now, if you had a little more than just basic networking skills or are lucky enough to work with people that do - you might be aware of a solution that is both elegant and scalable. Using routing protocols it is possible to split the traffic to a VIP across upstream routers and have multiple HAProxy instances process the flows. The reason this can work is that most modern routers are able to do load balancing per flow so that each TCP session consistently gets the same route - this means they will also get the same HAProxy instance. This is not a new practice and has been done for years in organizations that operate large scale services. In the wider operations community though, there doesn’t seem to be much discucssion. Technically, it is not hard or complicated, but it requires skills and expereinces that are less common.

Knowing the basics, there are multiple ways of accomplishing this. CloudFlare uses Anycast to solve this problem, and a blog post by Allan Feid at Shutterstock explains how you could run ExaBGP to announce or whitdraw routes to a service. In short, if HAProxy is up serving connections, use ExaBGP to announce to the upstream router that the route is available. In case of failure, do the opposite, tell the router that this route is no longer available for traffic.

I’m going to describe a solution that is similar but expand it a bit more, I hope you begin to see your services and datacenter a little differently.

haproxy ecmp

In this scenario there are two routers, r1 and r2, both announcing a route to the service IP across the network. This announcement is done using routing protocols like BGP or OSPF. It does not matter which one is used, for our use-case, they are functionally very close. Depending on how the larger network around r1 and r2 is designed they might not be receiving equal amounts of the traffic towards the service IP. If so, it is possible to have the routers balance the workload across n0 before routing the traffic to the service.

These routers (r1 and r2) are connected to both load balancers across different link networks (n1_ through n4) and have two equal cost routes set up to the service IP. They know they can reach the service IP across both links and must make a routing decision about which one to use.

haproxy ecmp hashing

The routers then use a hashing algorithm on the packets in the flow to make that decision. A typical algorithm looks at Layer 3 and Layer 4 information as a tuple, e.g source IP, destination IP, source port and destination port, and then calculate a hash. If configured correctly, both routers will calculate the same hash and consequently install the same route, routing traffic to the same load balancer instance. Configuring hashing algorithms on the routers is what I’d consider the hardest part of getting a working solution. Not all routers are able to do it and trying to find documentation about it is hard.

Another approach is not using hardware routers at all and rely only on the Linux kernel and a software routing daemon like BIRD or Quagga. These would then be serving as dedicated routing servers in the setup, replacing the r1 and r2 hardware devices.

Regardless of using hardware or software routers, what makes this setup effective is that you do not interrupt any traffic when network changes take place. If r1 is administratively taken offline, routing information in the network will be updated so that the peering routers only use r2 as a destination for traffic towards the service IP. As for HAProxy it does not need to know that this is happening. Existing sessions (flows) won’t be interrupted and will be drained off r1.

haproxy ecmp failure

For minimizing unplanned downtime, optimizing configuration on r1 and r2 for fast convergence - quick recovery from an unknown state, is essential. Rather than adjusting routing protocol timers I’d recommend using other forms of convergence optimization, like Bidirectional Forwarding Detection (BFD). The BFD failure detection timers have much shorter time limits than the failure detection mechanisms in the routing protcols, so they provide faster detection. This means recovery can be fast, even sub-second, and data loss minimalized.

Automated health checks (mis)using Bidirectional Forwarding Detection

Now we need to define how to communicate with the routers from the HAProxy instances. They need to be able to communitcate with the routing layer to start or stop sending traffic in their direction. In practice that means to signal the routers to add or withdraw one of the routes to the service IP address. Again, there are multiple ways of acheiving this but simplicity is our goal. For this solution I’ll again focus on BFD. My contacts over at UNINETT in Trondheim have had success using OpenBFDD, an open source implementation of BFD, to initiate these routing updates. BFD is a network protocol used to detect faults between devices connected by a link. Standards-wise it is at the RFC stage according to Wikipedia. It is low-overhead and fast, so it’s perfect for our simple functional needs. While both Quagga and BIRD have support for BFD, OpenBFDD can be used as a standalone mechanism, removing the need for running a full routing daemon on your load balancer.

To set this up, you would run bfdd-beacon on your HAProxy nodes, and then send it commands from its control utility bfdd-control. Of course this is something you’d want to automate in your HAProxy health status checks. As an example, this is a simple Python daemon that will run in the background, check HAProxy status and interfaces every second, and signal the upstream routers about state changes:

#!/usr/bin/env python
import os.path
import requests
import time
import subprocess
import logging
import argparse
from daemonize import Daemonize

APP = "project_bfd_monitor"
DESCRIPTION = "Check that everything is ok, and signal link down via bfd otherwise"
ADMIN_DOWN_MARKER = "/etc/admin_down"
HAPROXY_CHECK_URL = "http://localhost:1936/haproxy_up"


def check_state(interface):
    try:
        response = requests.get(HAPROXY_CHECK_URL, timeout=1)
        response.raise_for_status()
    except:
        return "down"
    ifstate_filename = "/sys/class/net/{}/operstate".format(interface)
    if not os.path.exists(ifstate_filename) or open(ifstate_filename).read().strip() != "up":
        return "down"
    if os.path.exists(ADMIN_DOWN_MARKER):
        return "admin"
    return "up"


def set_state(new_state):
    if new_state not in ("up", "down", "admin"):
        raise ValueError("Invalid new state: {}".format(new_state))
    subprocess.call(["/usr/local/bin/bfdd-control", "session", "all", "state", new_state])


def main(logfile, interface):
    logging.basicConfig(level=logging.INFO,
                        format='%(asctime)s %(name)s %(levelname)s %(message)s')
    logging.getLogger("requests").setLevel(logging.WARNING)
    if logfile:
        handler = logging.handlers.RotatingFileHandler(logfile,
                                                       maxBytes=10*1024**3, backupCount=5)
        handler.setFormatter(logging.getLogger("").handlers[0].formatter)
        logging.getLogger("").addHandler(handler)
    state = check_state(interface)
    set_state(state)
    logging.info("bfd-check starting, initial state: %s", state)
    while True:
        time.sleep(1)
        new_state = check_state(interface)
        if new_state != state:
            set_state(new_state)
            logging.info("state changed from %s to %s", state, new_state)
            state = new_state


def parse_args():
    parser = argparse.ArgumentParser(description=DESCRIPTION)
    parser.add_argument('-d', '--daemonize', default=False, action='store_true',
                        help="Run as daemon")
    parser.add_argument('--pidfile', type=str, default="/var/run/{}.pid".format(APP),
                        help="pidfile when run as daemon")
    parser.add_argument('--logfile', default='/var/log/{}.log'.format(APP),
                        help="logfile to use")
    parser.add_argument('--interface', help="Downstream interface to monitor status of")

    return parser.parse_args()

if __name__ == '__main__':
    args = parse_args()
    if args.daemonize:
        daemon_main = lambda: main(args.logfile, args.interface)
        daemon = Daemonize(app=APP, pid=args.pidfile, action=daemon_main)
        daemon.start()
    else:
        main(None, args.interface)

There are three main functions. check_state() requests the HAProxy stats uri and checks status of the monitored network interface through SysFS. main() runs a while True loop that calls check_state() every second. If state has changed, set_state() will be called and a bfdd-control subprocess ran to signal the new state through the protocol to the listening routers. One interesting thing to note about the admin down state - it is actually part of the BFD protocol standard as defined by the RFC. As a consequence, taking a load balancer out of service is as simple as marking it down, then waiting for its sessions to drain.

When designing the HAProxy health checks to run there is an important factor to remember. You don’t want complicated health checks, and there is no point in exposing any application or service-related checks through to the routing layer. As long as HAProxy is up serving connections, we want to continue receiving traffic and stay up.

Conclusion

Standards driven network design with core services implemented using open source software is currently gaining acceptance. Traditionally, developer and operations teams have had little knowledge of and ownership to this part of infrastructure. Shared knowledge of Layer 3 protocols and routing will be crucial for any organization building or operating IT services going forward. Load balancing is a problem space that needs multi-domain knowledge, and greatly benifits from integrated teams. Integrating knowlege of IP networks and routing with application service delivery allows the creation of flexible load balancing systems while staying vendor-neutral.

Interesting connections are most often made when people of diverse backgrounds meet and form a new relationship. If you know a network engineer, the next time you talk, ask about Bidirectional Forwarding Detection and convergence times. It could become an interesting conversation!

Thank you to Sigmund Augdal at UNINETT for sharing the Python code in this article. His current version is available on their Gitlab service.

December 10, 2010

Day 10 - Basic Sniffing with tcpdump

This article was written by Evan Anderson

The How and Why of Sniffing

It starts with something like an innocuous-sounding error message during setup of a new piece of software: "Fatal Error: Can't connect to server." You peruse the configuration files again and can't see anything wrong. You check the documentation and note that it isn't exactly clear on the syntax (FQDN of the server or the DN of the server object the LDAP directory, etc). You know the story-- the documentation is unclear and you're not sure if you've got things configured right. You try it both ways and it still doesn't work. You scratch your head, check for working name resolution on your machine again, and try to think about what you might've missed.

This story plays out over and over with different OS's and applications but the frustration is the same. "Why isn't this thing working?" "What do you mean 'Cannot connect' !?!" Wouldn't it be nice to see what's actually being sent back and forth on the wire instead of poking around in the dark?

I'm regularly surprised at how long it takes sysadmins to reach for the sniffer. Many times I've found that sniffing traffic early in the process of troubleshooting, often while taking stock of the issue and documenting the symptoms, ends up revealing the root cause of issues. Sniffers aren't just for "network guys", and as a sysadmin you'll do well to become familiar with a sniffer for your operating system of choice.

The particular challenges related to bringing a sniffer to bear on a problem typically come (a) from getting the sniffer installed, (b) deciding how to capture the traffic you're looking for, and (c) filtering out extraneous traffic such that you can end up with a sample size small enough to make sense out of.

A piece of terminology worth mentioning as you get into using sniffers is the phrase promiscuous mode. Typically an Ethernet network interface card (NIC) and /or its driver will only forward broadcast frames or frames explicitly addressed to the NIC's physical address up to the operating system. If the NIC receives frames destined for other hosts (as would be the case in "old school" shared-media Ethernet) they are simply ignored. In promiscuous mode all frames received by the NIC are forwarded up to the operating system. Most operating systems restrict switching an interface from normal operation to promiscuous mode to only privileged users (root, Administrator, etc).

It's also bears mention that the architecture of the Windows networking stack doesn't permit sniffing of traffic to 127.0.0.1 in any reasonably easy manner. You can do this on most *nix operating systems, but the Windows networking stack architecture isn't conducive to this type of capture.

Finally, this article talks in broad terms but, generally, is oriented toward traffic capture on wired Ethernet networks. Capturing traffic on wireless Ethernet networks, in particular, comes with its own set of concerns, and is really a topic unto itself.

tcpdump and WinDump

On *nix operating systems tcpdump reigns supreme as the sniffer of choice. Most Linux distributions, including many tiny space-conscious embedded distributions, have a binary available. The pervasive availability is a testament to its utility. In the Windows world, a port of tcpdump called WinDump is available and mimics the functionality of tcpdump. The WinPcap driver is required to facilitate the low-level packet capture.

The learning-curve for tcpdump isn't particularly steep assuming you have a comfort-level with the command-line. The manual page for tcpdump is the canonical reference. Some common command-line arguments that I use include:

  • -X -- Display packets in hex and ASCII
  • -n -- Don't resolve addresses to hostnames
  • -s N -- Capture N bytes from each packet (defaults to 68). Set to 0 to capture entire packets.
  • -i x -- Capture from interface x, or any (on most *nix operating systems) to capture from all interfaces (useful to see if you're getting anything, but captures from any aren't performed in promiscuous mode so only traffic to / from the host will be captured)
  • -D -- Dumps a list of available interfaces (very useful in Windows since the interface names aren't easy things to type like eth0)

Filtering traffic

Capturing everything on the wire isn't tremendously useful since you're likely to be deluged with more information than you can handle. Turning off reverse DNS lookups with the -n option is a nice first step (because the reverse lookups themselves will end up generating more traffic), but filtering the traffic is essential to pinpointing exactly what you're looking for. The tcpdump filter syntax is very human-readable and reasonably intuitive so it's pretty easy to get started.

Suppose you're interested in seeing a hex dump of packets on your eth0 interface, without resolving addresses to hostnames, for the LDAP protocol (or, at least, the standard TCP port LDAP runs on). You can do that with the command: tcpdump -i eth0 -n -X tcp port 389. The filter portion of this command, tcp port 389 is fairly easy to understand. Other example filters include:

  • host 10.1.1.1 -- Captures only traffic to / from the host 10.1.1.1
  • src 10.1.1.1 -- Captures only traffic sourced by 10.1.1.1
  • dst tcp port 22 -- Captures only traffic destined for TCP port 22

Bear in mind that filters that mention "src" and "dst" only capture one direction of a conversation because they only match against the source or destination address or port number.

Using boolean operators allows you to get fancier with your capture. Suppose you're connected to a host with SSH (or RDP, in the Windows world-- just substitute 3389 into the example) and you want to capture all traffic except the traffic moving between the remote host and your machine (hypothetically at 10.1.1.2). You can use the boolean not operator to exclude that traffic with the very simplistic filter: not host 10.1.1.2

While that filter will work, it will also exclude all other traffic between your computer and the remote host. With some clever use of parenthesis and the boolean and operator you can construct a more complex filter that allows any non-SSH traffic between your computer and the remote host to be captured: not (tcp port 22 and host 10.1.1.2) (Beware that using parens on a *nix OS may require you to surround the filter expression with quotes since your shell is likely going to see the parenthesis as shell metacharacters!)

As a general filtering strategy, if I know what the traffic is that I'm trying to capture I write a filter that includes only the traffic I'm looking for. If I'm unsure about what I'm looking for I begin by capturing everything for a short period of time, reviewing the captured data, and creating a progressively longer filter excluding more types of traffic that aren't what I want. So, a filter that might start as something really simple like ip might become ip and not (tcp port 443 or icmp or tcp port 80 or tcp port 22 or udp port 53) as I find traffic that I don't want to see in my capture.

The best way to get familiar with tcpdump filters is to start using them. Capture known traffic and attempt to filter it. The manual page provides some much more detailed examples (performing bitwise comparisons of TCP header fields to catch packets with particular flags set, etc) to get you started.

Saving captures

tcpdump has the handy feature of allowing you to save captures to disk and replay them. The replay functionality is particularly handy if you want to capture traffic on one host then ship it to another host (or even another program, like Wireshark) for analysis.

The -w file argument specifies that packets should be written to the specified file rather than decoded and displayed. You can also use the optional -C argument to limit the size of capture files and the -W argument to specify the number of capture files to maintain. For long-term traffic analysis the latter two options can be used to create a "ring buffer" of capture files that will be re-used ad infinitum.

Once you've captured traffic you can "play it back" with tcpdump by using the -r file argument to read the captured traffic from file. Traffic read from a file "acts" like traffic being captured from an interface so all the command-line arguments to manipulate the output behaviour, and to filter the traffic stream, are applied in the same manner as traffic being captured from an interface.

Getting to the traffic

As we've already seen with using tcpdump's capability to write captures to disk remote executing of tcpdump is one method that can be used to capture traffic in situations where the traffic might not flow to or from your computer. If you need to monitor traffic between hosts where you can't run tcpdump you'll have to think of some way to bring the traffic to you. Some options to get to the traffic include:

  • Switch-based monitoring - Different Ethernet switch manufacturers call this mechanism by different names (SPAN, port-mirroring, monitor ports), but the functionality is the same. The Ethernet switch can "tee" the traffic in one or both directions from one or more ports into a dedicated "monitoring port" where your sniffer is connected. Most of the time the monitor port won't function as a normal network connection while monitoring is enabled so be wary that you may need a second interface in your sniffer computer, attached to a non-monitor network port, if you want communication with the network as-normal while you are monitoring. This is typically the least disruptive method for getting your sniffer in-line with the traffic to be captured, but requires a switch with monitoring capability and the cooperation of whoever manages the switch.

  • Insert a shared medium - It's a less common technique today with gigabit Ethernet being more pervasive, but an older technique for monitoring traffic included attaching a shared medium, like an Ethernet hub, between the host to be monitored and the LAN switch. Traffic moving through an Ethernet hub appears on all ports of the device, unlike an Ethernet switch. Attaching the LAN to one port of the hub, the host to be monitored to another port on the hub, and the sniffer to a third port permitted monitoring of the traffic between the host and the LAN. Since there aren't gigabit Ethernet hubs this method has become less commonplace as gigabit Ethernet has become more common.

  • Physically intercept the connection - Most modern Linux distributions and Windows versions allow you to create a "network bridge" between two (or more) network interfaces. In cases where the traffic flow between the host to be monitored and the LAN is not so great as to overwhelm the CPU in your sniffer computer you can opt to create a network bridge and physically insert the sniffer computer between the host to be monitored and the LAN. Your sniffer software can be configured to capture traffic on the virtual "bridge interface". This method works for low bandwidth captures, but high traffic hosts can overwhelm the CPU of the sniffer computer with traffic.

  • Redirect the traffic flow - You can redirect the traffic flow between the host and the LAN through various methods. ARP cache poisoning, using tools like Ettercap can "trick" hosts into forwarding traffic through your sniffer machine. The specific details of using this tool are beyond this post but many guides are out there. Be warned that ARP cache poisoning may be detected by an intrusion detection system (IDS) as an attack. If you're going to use ARP cache poisoning on someone else's LAN be sure you've cleared it with the network or system administrators, lest you send them into a panic when their IDS starts sounding alarms.

    Another method for traffic flow redirection is to use a layer 7 proxy, such as rinetd, to redirect traffic flows through your sniffer computer. With this method you would configure your sniffer computer to answer for the protocol to be captured and to forward those incoming connections to the host where the "real" server software is running. Client computers will need to be reconfigured to use your sniffer computer's IP address as their "server" unless you change the server computer's IP address and assume its address with your sniffer computer. This is the method that I use when I can't get access to a switch monitor port and don't want to run the risk of scaring somebody with ARP cache poisoning.

From here?

The next time you're faced with an opaque and unhelpful "Can't connect to server"-type message take a moment and fire up tcpdump to see what's happening on the wire before you start double-checking configuration files or stopping and restarting service programs. Mis-specified host names, malformed configuration parameters, and a whole host of other maladies that could be hiding behind that opaque error message can become visible immediately once you look at the conversation actually taking place on the wire. Mysterious "delays" and "timeouts" are great candidates for troubleshooting with a sniffer. And, finally, even if you're not troubleshooting a problem just using a sniffer to analyze protocols can provide you with valuable details that will help your understanding.

Obviously, this article is just a brief introduction. tcpdump has capabilities that I haven't mentioned, and there are a wealth of other tools out there that can do more. Get out there and sniff some traffic!

Further reading