December 15, 2021

Day 15 - Introduction to the PagerDuty API

By: Mandi Walls (@lnxchk)
Edited by: Joe Block (@curiousbiped)

Keeping track of all the data generated by a distributed ecosystem is a daunting task. When something goes wrong, or a service isn’t behaving properly, tracking down the culprit and getting the right folks enabled to fix it is also challenging. PagerDuty can help you with these challenges.

The PagerDuty platform integrates with over 600 other components to gather data, add context, and process automation. Under the hood of all of these integrations is the PagerDuty API, ready to help you programmatically interact with your PagerDuty account.

What’s Exposed Via the API

The PagerDuty API provides access to all the structural objects in your PagerDuty account - users, teams, services, escalation policies, etc - and also to the data objects including incidents, events, and change events.

For objects like users, teams, escalation policies, schedules, and services, you may find using the PagerDuty Terraform Provider will help you maintain the state of your account more efficiently without using the API directly.

The other object types in PagerDuty are more useful when we can send them anytime from anywhere, including via the API from our own code. Let’s take a look at three of them: incidents, events, and change events. If you’d like a copy of the code for these examples, you can find them on Github.

API Basics

To write new information into PagerDuty via the API, you'll need some authorization. You can use OAuth, or create an API key. There are account-level and user-level API keys available. You'll use the account-level keys for the rest of the examples here and keep things simple.

To create a key in your PagerDuty app, you'll need Admin, Global Admin, or Account Owner access to your account. More on that here.

In PagerDuty, navigate to Integrations and then chose API Access Keys. Create a new key, give it a description, and save it somewhere safe. The keys are strings that look like y_NbAkKc66ryYTWUXYEu.

Now you’re ready to generate some incidents! These examples use curl, but there are a number of client libraries for the API as well.

Incidents

Incidents are probably what you’re most familiar with in PagerDuty - they represent a problem or issue that needs to be addressed and resolved. Sometimes this includes alerting a human responder. Many of the integrations in the PagerDuty ecosystem generate incidents from other systems and services to send to PagerDuty.

In PagerDuty, incidents are assigned explicitly to services in your account, so an incoming incident will register with only that service. If your database has too many long-running queries, you want an incident to be assigned to the PagerDuty service representing that database so responders have all the correct context to fix the issue.

If you have a service that doesn’t have an integration out of the box, you can still get information from that service into PagerDuty via the API, and you don’t need anything special to do it. You can send an incident to the API via a curl request to the https://api.pagerduty.com/incidents endpoint.

There are three required headers for these requests, Accept, Content-Type and From, which needs to be an email address associated with your account, for attribution of the incident. Setting up the request will look something like:


curl -X POST --header 'Content-Type: application-json' \
--url https://api.pagerduty.com/incidents \
--header 'Accept: application/vnd.pagerduty+json;version=2' \
--header 'Authorization: Token token=y_NbAkKc66ryYTWUXYEu' \
--header 'From: system2@myemail.com' \

Now you need the information bits of the incident. These will be passed as --data in the curl request. There are just a few required pieces to set up the format and a number of optional pieces that help add context to the incident.

The most important piece you'll need is the service ID. Every object in the PagerDuty platform has a unique identifier. You can find the ID of a service in its URL in the UI. It will be something like https://myaccount.pagerduty.com/service-directory/SERVICEID.

Now you can create the rest of the message with JSON:


curl -X POST --header 'Content-Type: application/json' \
--url https://api.pagerduty.com/incidents \
--header 'Accept: application/vnd.pagerduty+json;version=2' \
--header 'Authorization: Token token=y_NbAkKc66ryYTWUXYEu' \
--header 'From: system2@myemail.com' \
--data '{
  "incident": {
    "type": "incident",
    "title": "Too many blocked requests",
    "service": {
      "id": "PWIXJZS",
      "summary": null,
      "type": "service_reference",
      "self": null,
      "html_url": null
    },
    "body": {
      "type": "incident_body",
      "details": "The service queue is full. Requests are no longer being fulfilled."
    }
  }
}'

When you run this curl command, it will generate a new incident on the service PWIXJZS with the title "To many blocked requests", along with some context in the "body" of the data to help our responders. You can add diagnostics or other information here to help your team fix whatever is wrong.

What if there is information being generated that might not need an immediate response? Instead of an incident, you can create an event.

Events

Events are non-alerting items sent to PagerDuty. They can be processed via Event Rules to help create context on incidents or provide information about the behavior of your services. They utilize the PagerDuty Common Event Format to make processing and collating more effective.

Events are registered to a particular routing_key via an integration on a particular service in your PagerDuty account. In your PagerDuty account, select a service you'd like to send events to, or create new one to practice with. On the page for that service, select the Integrations tab and Add an Integration. For this integration, select "Events API V2" and click Add. You'll have a new integration on your service page. Click the gear icon, and copy the Integration Key. For the full walkthrough of this setup, see the docs.

The next step is to set up the event. The request is a little different from the incident request - the url is different, the From: header is not required, and the authorization is completely handled in the routing_key instead of using an API token.

The content of the request is more structured, based on the Common Event Format, so that you can create event rules and take actions if necessary based on what the events contain.


curl --request POST \
  --url https://events.pagerduty.com/v2/enqueue \
  --header 'Content-Type: application/json' \
  --data '{
  "payload": {
    "summary": "DISK at 99% on machine prod-datapipe03.example.com",
    "timestamp": "2021-11-17T08:42:58.315+0000",
    "severity": "critical",
    "source": "prod-datapipe03.example.com",
    "component": "mysql",
    "group": "prod-datapipe",
    "class": "disk",
    "custom_details": {
      "free space": "1%",
      "ping time": "1500ms",
      "load avg": 0.75
    }
  },
  “event_action”: “trigger”,
  "routing_key": "e93facc04764012d7bfb002500d5d1a6"
}'

Change Events

A third type of contextual data you can send to the API is a Change Event. Change events are non-alerting, and help add context to a service. They are informational data about what's changing in your environment, and while they don't generate an incident, they can inform responders about other activities in the system that might have contributed to a running incident. Change events might come from build and deploy services, infrastructure as code, security updates, or other places that change is generated in your environment.

These events have a similar basic structure to the general events, and the setup with the routing_key is the same, as you can see in the below example. The custom_details can contain anything you want, like the build number, a link to the build report, or the list of objects that were changed during an Infrastructure as Code execution.

Change events have a time horizon. They expire after 90 days in the system, so you aren't looking at old context based on past changes.


curl --request POST \
  --url https://events.pagerduty.com/v2/change/enqueue \
  --header 'Content-Type: application/json' \
  --data '{
  "routing_key": "737ea619db564d41bd9824063e1f6b08",
  "payload": {
    "summary": "Build Success: Increase snapshot create timeout to 30 seconds",
    "timestamp": "2021-11-17T09:42:58.315+0000",
    "source": "prod-build-agent-i-0b148d1040d565540",
    "custom_details": {
      "build_state": "passed",
      "build_number": "220",
      "run_time": "1236s"
    }
  }
}'

Adding Notes

One final fun bit of functionality you can leverage in PagerDuty's API is with notes. Notes are short text entries added to the timeline of an incident. In some integrations, like PagerDuty and Slack, notes will be sent to any Slack channel that is configured to receive updates for an impacted service, making them helpful for responders to coordinate and record activity across different teams.

Notes are associated with a specific incident, so when you are creating a note, the url will include the incident ID. Incident IDs are similar to the other object IDs in PagerDuty in that you can find them from the URL of the incident in the UI. They are longer strings than other objects than the service ID in the examples above.

The content of a note can be anything that might be interesting to the timeline of the incident, like commands that have been run, notifications that have been sent, or additional data and links for responders and stakeholders.


curl --request POST \
  --url https://api.pagerduty.com/incidents/{id}/notes \
  --header 'Accept: application/vnd.pagerduty+json;version=2' \
  --header 'Authorization: Token token=y_NbAkKc66ryYTWUXYEu' \
  --header 'Content-Type: application/json' \
  --header 'From: responder2@myemail.com' \
  --data '{
  "note": {
    "content": "Firefighters are on the scene."
  }
}'

Responders utilizing the UI will see notes in a widget on the incident pag.

Next Steps

Using the API to create tooling where integrations don't yet exist, or for internally-developed services, can help your team stay on top of all the moving parts of your ecosystem when you have an incident. Learn more about the PagerDuty resources available at https://developer.pagerduty.com/. Join the PagerDuty Community to learn from other folks working in PagerDuty, ask questions, and get answers.

December 14, 2021

Day 14 - What's in a job description (and who does it keep away)?

By: Daniel Medina
Edited by: James Turnbull (@kartar)

A colleague supporting our recruitment efforts asked hiring managers if their "job descriptions are still partying like it's 1999?" The point was to revisit old postings that had been copy-and-pasted down the years and create something that would increase engagement with candidates. But reading the title made me think about a job I applied for (and got) circa 1999. It was a systems administrator role and included language like

The associate must regularly lift and/or move 20-35 pounds and occasionally lift or pull 35-80 pounds.

No joke, those Sun Microsystems monitors were heavy. Checking a fact sheet confirms the "flat screen" (non-curved) 21-inch CRT from around that time was ~80 pounds.

Large network switches in the Cisco Catalyst 6500 family were easily twice that weight and were definitely a two-person job. Best practice for racking servers in the datacenter was to use a Genie Lift.

To this day, if I hear someone talking about a strong developer I might wonder "but how much can they deadlift?" Most job descriptions for roles outside physical datacenter management don't include this language anymore. This all got me thinking, what might be in job descriptions these days that could be turning off candidates?

"Education Level" might be one of those things we should re-think. Many postings require a "Bachelor's Degree". Granted, we don't describe what that degree is in and I've had colleagues with degrees in History, Library Sciences, Geology, Economics, and more (even Computer Science!)

Sometimes the phrase "or equivalent experience" is added to these requirements. It's unclear if this means something akin to a college experience, for example, thirteen weeks reading The Illiad in your teenage years. I've had colleagues who are Managing Directors and Distinguished Engineers with no college degrees; so why bother asking for this in our requirements? Maybe it's cloned from an existing description, or it's a required field in the system used to post the description and the option "None" isn't pre-filled. At best it's a proxy that means we're really looking for someone older than 21. At worst, we've dissuaded some candidates from considering us.

Sometimes the HR systems used for creating job descriptions can add unexpected data to your job descriptions. One job description posted in Montreal automatically included "Knowledge of French and English is required". This wasn't a Language Requirement that came from us! We were at a global firm using English as a common language and would be happy to hire anyone who met Canadian work requirements and had the skills we were looking for!

Other French-language oddities you may encounter are labels like "(H/F)" to indicate "Homme / Femme", that the job description is intended to be gender-neutral, despite pronouns and gendered language used throughout. This isn't as awkward as some of the "s/he will..." references used in English-language descriptions when the simpler "you", speaking directly to the candidate, seems so much more natural!

Speaking of strange language, some descriptions include language that doesn't make me think first of a technology role:

I'm hiring... a hacker that wants to work on the bleeding edge...
We spend a lot of time doing applied research...
You should be the type of person who likes to roll up their sleeves and get their hands dirty.
Source: Wikipedia: _Dexter (season 2)

Your signal that you have an existing, tight-knit group:

You'll be part of a small team of like-minded individuals.

might run counter to your efforts to advertise your goals of building a diverse and inclusive environment, one where the candidate-turned-new-joiner might not be able to provide their valuable external input if it will run counter to the current thinking.

We found that we were having trouble filling a "DevOps" role. Without suggesting that "DevOps isn't a job title", candidates wanted clarification on what that might mean in our environment. Reviewing some of the many open roles across different teams showed they varied widely, leaving candidates to try to figure out which of the DevOps Topologies they might be walking into (and was it a Pattern or Anti-Pattern?!)

These included:

  • Cloud SecDevOps (Cyber): This wins keyword bingo
  • Apply Now to The Wonderful World of DevOps: Points for creative use of the job title field
  • Devops Specialist - Private Cloud: "providing L3 support... including on-call"
  • DevOps Developer: "You are a developer who is not afraid of infrastructure. You identify with the 'Dev' in DevOps way more than the 'Ops'"
  • DevOps App Dev: A "release engineer" role that sounded more like DevOps in practice
  • DevOps Authentication Security L3 Engineer: Okay...

Much of this has been about job descriptions that can lose candidates. What should you include to gain credibility and interest? An honest declaration of the mission of the group they’re joining always helps. Don't shy away from describing a need to support existing legacy systems, even if the goal is to modernize and move to a new platform. Describe the lifecycle of the team; is it "newly formed", "fast-growing", or is this a chance to "join an established team" and learn from established experts?

What's the topology of the team, distributed (participation from a range of locations and timezones in an asynchronous arrangement), multi-site (people working from two or perhaps three sites passing of work between each other or operating in overlapping times), or fully co-located (in rough time or location)? This can affect travel, working hours, and collaboration styles.

Basic details of work-life balance should be included. These might include remote work arrangements (which will likely become a lasting legacy of the pandemic era), on-call staffing strategies, night and weekend work requirements, or travel requirements. We tend to advertise "flexible opportunities", which may have some constraints (we may want individuals to reside in a specific country but not care as much about sitting in an office).

Some of the most thoughtful job descriptions lay out a multi-month roadmap for the role and growth. "Within three months we expect you to join our on-call rotation in support of our production environment", "Within six months you will obtain certification in at least one of our hosting platforms", "Within nine months you will be doing my job and I will be riding off into the sunset", etc. Having such a timeline is important to set expectations for performance during any initial probation period that may be part of local labor law or new hire contract. This also sets a pace for someone to ramp up in your environment, ensuring enough time is set aside for required learning as opposed to "throwing them in the deep end".

I've made all the mistakes described here but can take some solace that I've created zero job postings seeking ninjas, rockstars, gurus, or wizards! Best of luck to all the hiring managers out there looking for their unicorns!

Source: Wikipedia: _Kiss (band)_

December 13, 2021

Day 13 - Ephemeral PR Environments: Enabling automated testing at a rapid pace

By: Amar Sattaur
Edited by: Jennifer Davis (@sigje)

Recently, I've been thinking a lot about how to implement the concepts of least privilege while also speeding up the feedback cycle in the developer workflow. However, these two things are not very quickly intertwined. Therefore, there needs to be underlying tooling and visibility to show developers the data they need for a successful PR merge.

A developer doesn't care about what those underlying tools are; they just want access to a system where they can:

  • See the logs of the app that they're making a change for and the other relevant apps
  • See the metrics of their app so they can adequately gauge performance impact

One way to achieve this is with ephemeral environments based on PR's. The idea is that the developer opens up a PR and then automatically a new environment is spun up based on provided defaults with the conditions that the environment is:

  • deployed in the same way that dev/stage/prod are deployed, just with a few key elements different
  • labeled correctly so that the NOC/Ops teams know the purpose of these resources
  • Integrated with logging/metrics and useful tags so that the engineer can easily see metrics for this given PR build

That sounds like a daunting task but through the use of Kubernetes, Helm, a CI Platform (GitHub Actions in this tutorial) and ArgoCD, you can make this a reality. Let's look at an example application leveraging all of this technology.

Example app

You can find all the code readily available in this GitHub Repo.

Pre-requisites Used in this Example

Tool Version
kubectl v1.21
Kubernetes Cluster v1.20.9
Helm v3.6.3
ArgoCD v2.0.5
kube-prometheus-stack v0.50.0

The example app that you’re going to deploy today is a Prometheus exporter that exports a custom metric with an overridable label set:

  • The `version` of the deployed app
  • The `branch` of the PR
  • The PR ID

Pipeline

Now that I've defined the goal, let's go a little more in-depth on how you'll get there. First, let's take a look at the PR pipeline in .github/workflows/pull_requests.yml:


---
name: 'Build image and push PR image to ghcr'
on:
  pull_request:
    types: [assigned, opened, synchronize, reopened]
    branches:
      - main

jobs:
  build:
    name: Build
    runs-on: ubuntu-latest
    steps:
      - name: Checkout
        uses: actions/checkout@v2
      - name: Build image
        uses: docker/build-push-action@v1
        with:
          registry: ghcr.io
          username: ${{ github.repository_owner }}
          password: ${{ secrets.GITHUB_TOKEN }}
          tags: PR-${{ github.event.pull_request.number }}
       

This pipeline runs on pull requests events to the main branch. So, when you open a PR, push a commit to an existing PR, reopen a closed PR, or assign it to a user, this pipeline will get triggered. It defines two workflows, the first of which is build. It's relatively straightforward: take the Dockerfile that lives in the root of your repo and build a container image out of it and tag it for use with GitHub Container Registry. The tag is the PR ID of the triggering pull request.

The second workflow is the one where we deploy to ArgoCD:


 deploy:
    needs: build
    container: ghcr.io/jodybro/argocd-cli:1.1.0
    runs-on: ubuntu-latest
    steps:
      - name: Log into argocd
        run: |
          argocd login ${{ secrets.ARGOCD_GRPC_SERVER }} --username ${{ secrets.ARGOCD_USER }} --password ${{ secrets.ARGOCD_PASSWORD }}
      - name: Deploy PR Build
        run: |
          argocd app create sysadvent2021-pr-${{ github.event.pull_request.number }} \
            --repo https://github.com/jodybro/sysadvent2021.git \
            --revision ${{ github.head_ref }} \
            --path . \
            --upsert \
            --dest-namespace argocd \
            --dest-server https://kubernetes.default.svc \
            --sync-policy automated \
            --values values.yaml \
            --helm-set version="PR-${{ github.event.pull_request.number }}" \
            --helm-set name="sysadvent2021-pr-${{ github.event.pull_request.number }}" \
            --helm-set env[0].value="PR-${{ github.event.pull_request.number }}" \
            --helm-set env[1].value="${{ github.head_ref }}" \
            --helm-set env[2].value="sysadvent2021-pr-${{ github.event.pull_request.number }}"
       

This workflow runs a custom image that I wrote that wraps the argocd cli tool in a container and allows for arbitrary commands to be executed against an authenticated ArgoCD instance.

It then creates a Kubernetes object of kind: Application which is a CRD that ArgoCD deploys into your cluster to define where you want to pull the application from and how to deploy it (helm/kustomize etc..).

Putting it all together

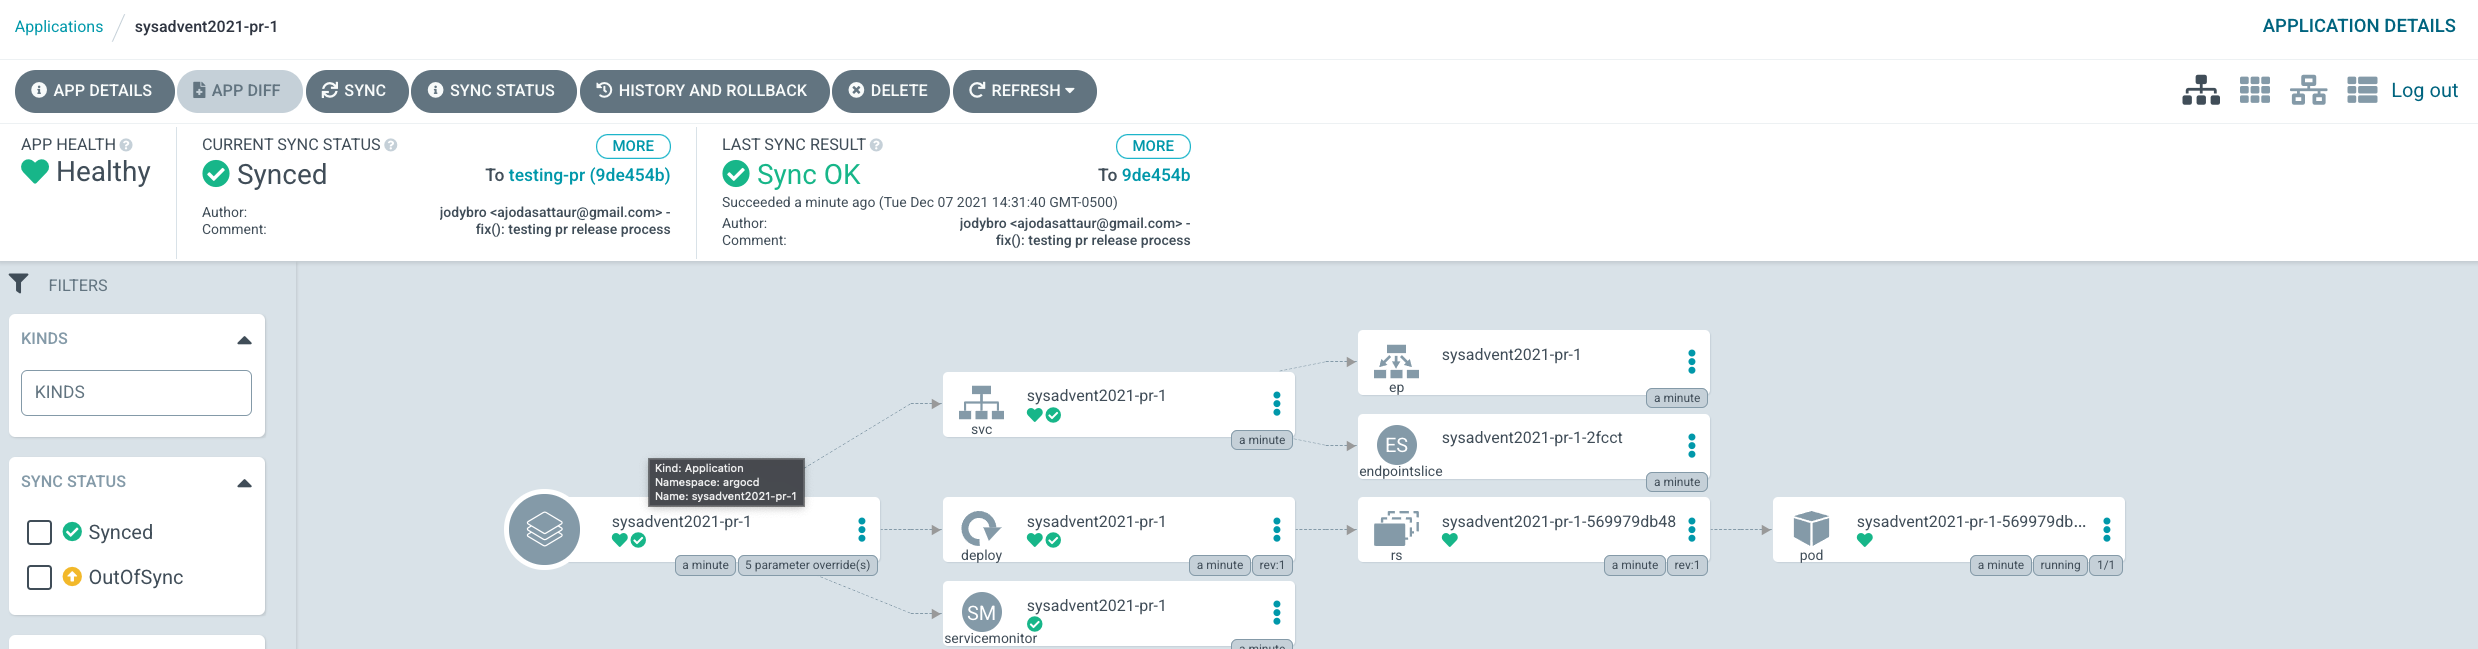
Now, let's see this pipeline in action. First, head to your repo and create a PR against the main branch with some changes; it doesn't matter what the changes are as all PR events will trigger the pipeline.

You can see that my PR has triggered a pipeline which can be viewed here. Furthermore, you can see that this pipeline was executed successfully, so if I go to my ArgoCD instance, I would see an application with this PR ID.

So, if you are following along, now you have two deployments of this example app, one should show labels for the main branch, and one should show labels for the PR branch.

Let's verify by port-forwarding to each and see what you get back.

Main branch

First, let's check out the main branch application:


kubectl port-forward service/sysadvent2021-main 8000:8000 
Forwarding from 127.0.0.1:8000 -> 8000
Forwarding from [::1]:8000 -> 8000
       

As you can see, the branch is set to main with the correct version.

And if you check out the state of our Application in ArgoCD:

Everything is healthy!

PR

Now let's check the PR deployment:


kubectl port-forward service/sysadvent2021-pr-1 8000:8000 
Forwarding from 127.0.0.1:8000 -> 8000
Forwarding from [::1]:8000 -> 8000
       

This one's labels are showing the branch and the version from the PR.

This pod returns:

And in ArgoCD:

Final thoughts

It really is that easy to get PR environments running in your company!

Resources

* Source Code Repo

December 12, 2021

Day 12 - Terraform Refactoring

By: Bill O'Neill (@woneill)
Edited by: Kerim Satirli (@ksatirli)

Terraform is "Infrastructure as Code" and like all code, it is beneficial to review and refactor to:

  • improve code readability and reduce complexity
  • improve the maintainability of the source code
  • create a simpler, cleaner, and more expressive internal architecture or object model to improve extensibility

This article outlines the approaches that have helped my teams when refactoring Terraform code bases.

Convert modules to independent Git repositories

If your Terraform Git repository has grown organically, you will likely have a monorepo structure complete with embedded modules, similar to this:

$ tree terraform-monorepo/
.
├── README.md
├── main.tf
├── variables.tf
├── outputs.tf
├── ...
├── modules/
│   ├── moduleA/
│   │   ├── README.md
│   │   ├── variables.tf
│   │   ├── main.tf
│   │   ├── outputs.tf
│   ├── moduleB/
│   ├── .../

Encapsulating resources within modules is a great step, but the monorepo structure makes it difficult to iterate on individual module development, down the line.

Splitting the modules into independent Git repositories will:

  • Enable module development in an isolated manner
  • Support re-use of module logic in other Terraform code bases, across your organization
  • Enable publishing to public and private Terraform Registries

Here's a process that you can follow to make a module a stand-alone Git repository while preserving the historical log messages. The steps are examples of how to extract moduleA from the above file tree into its own git repository.

  1. Clone the Terraform Git repository to a new directory. I recommend naming the directory after the module you plan on converting.
    git clone <REMOTE_URL> moduleA
  2. Change into the new directory:
    cd moduleA
  3. Use git filter-branch to split out the module into a new repository..
    FILTER_BRANCH_SQUELCH_WARNING=1 git filter-branch --subdirectory-filter modules/moduleA -- --all

    Note that we're squelching the warning about filter-branch. See the filter-branch manual page for more details if you're interested

  4. Now your directory will only contain the contents of the module itself, while still having access to the full Git history.

    You can run git log to confirm this.
  5. Create a new Git repository and obtain the remote URL for it, then update the origin in the filtered repository:
    git remote set-url origin <NEW_REMOTE_URL>
    git push -u origin main
    
  6. Tag the repo as v1.0.0 before making any changes

       
    git tag v1.0.0
    git push --tags
    
  7. Now that the new repository is ready to be used, update the existing references to the module to use a source argument that points to the tag that you just created.

    The “Generic Git Repository” section in Terraform's Module Sources documentation has more details on the format.

    Replace lines such as

    source = "../modules/moduleA"


    with

    source = "git::<NEW_REMOTE_URL>?ref=v1.0.0"
    
  8. Alternatively, publishing your module to a Terraform registry is an option (but this is outside the scope of this article).
  9. Once all source arguments that previously pointed to the directory path have been replaced with references to Git repositories or Terraform registry references, delete the directory-based module in the original Terraform repository.

Update version constraints with tfupdate

Masayuki Morita's tfupdate utility can be used to recursively update version constraints of Terraform core, providers, and modules.

As you start refactoring modules and bumping their version tags, tfupdate becomes an invaluable tool to ensure all references have been updated.

Some examples of tfupdate usage, assuming the current directory is to be updated:

  • Updating the version of Terraform core:
    tfupdate terraform --version 1.0.11 --recursive .
  • Updating the version of the Google Terraform provider:
    tfupdate provider google --version 4.3.0 --recursive .
  • Updating the version references of Git-based module sources can be done with the module subcommand, for example:
    tfupdate module git::<REMOTE_URL> --version 1.0.1 --recursive .

Test state migrations with tfmigrate

Many Terraform users are hesitant to refactor their code base, since changes can require updates to the state configuration. Manually updating the state in a safe way involves duplicating the state, updating it locally, then copying it back in place.

In addition to tfupdate, Masayuki Morita has another excellent utility that can be used to apply Terraform state operations in a declarative way while validating the changes, before committing them: tfmigrate

You can do a dry run migration where you simulate state operations with a temporary local state file and check to see if terraform plan has no changes after the migration., This workflow is safe and non-disruptive, as it does not actually update the remote state.

If the dry run migration looks good, you can use tfmigrate to apply the state operations in a single transaction instead of multiple, individual changes.

Migrations are written in HCL and use the following format:

migration "state" "test" {
  dir = "."
  actions = [
    "mv google_storage_backup.stage-backups google_storage_backup.stage_backups",
    "mv google_storage_backup.prod-backups google_storage_backup.prod_backups",
  ]
}

Each action line is functionally identical to the command you’d run manually such as terraform state <action> …. A full list of possible actions is available on the tfmigrate website.

Quoting resources that have indexed keys can be tricky. The best approach appears to be using a single quote around the entire resource and then escaping the double quotes in the index. For example:

actions = [
    "mv docker_container.nginx 'docker_container.nginx[\"This is an example\"]'",
]

Testing the state migrations can be done via tfmigrate plan <filename>. The output will show you what terraform plan would look like if you had actually carried out the state changes.

Applying the migration to the actual state is done via terraform apply <filename>. Note that by default, it will only apply the changes if the result from tfmigrate plan was a clean output.

If you still want to apply changes to a “dirty” state, you can do so by adding a force = true line to the migration file.

If you are using Terraform 1.1 or newer, there is now a built-in moved statement that works similarly to these approaches. I haven’t tested it out yet but it looks like a useful feature! I can see it being especially useful for users who may not have direct access to state files such as Terraform Cloud and Enterprise users or Atlantis users.

See the announcement in the 1.1 release as well the HashiCorp Learn tutorial for more details.

Ensure standards compliance with TFLint

According to its website, TFLint is a Terraform linter with a handful of key features:

  • Finding possible errors (like illegal instance types) for major Cloud providers (AWS/Azure/GCP)
  • Warning about deprecated syntax and unused declarations
  • Enforcing best practices and naming conventions

TFLint has a plugin system for including cloud provider-specific linting rules as well as updated Terraform rules. Setting up the list of rules can be done on the command line but it is recommended to use a config file to manage the extensive list of rules to apply to your codebase.

Here is a configuration file that enables all of the possible terraform rules as well as includes AWS specific rules. Save it in the root of your Git repository as .tflint.hcl then initialize TFLint by running tflint –init. Now you can lint your codebase by running tflint

config {
  module              = false
  disabled_by_default = true
}

plugin "aws" {
  enabled = true
  version = "0.10.1"
  source  = "github.com/terraform-linters/tflint-ruleset-aws"
}

rule "terraform_comment_syntax" {
  enabled = true
}

rule "terraform_deprecated_index" {
  enabled = true
}

rule "terraform_deprecated_interpolation" {
  enabled = true
}

rule "terraform_documented_outputs" {
  enabled = true
}

rule "terraform_documented_variables" {
  enabled = true
}

rule "terraform_module_pinned_source" {
  enabled = true
}

rule "terraform_module_version" {
  enabled = true
  exact = false # default
}

rule "terraform_naming_convention" {
  enabled = true
}

rule "terraform_required_providers" {
  enabled = true
}

rule "terraform_required_version" {
  enabled = true
}

rule "terraform_standard_module_structure" {
  enabled = true
}

rule "terraform_typed_variables" {
  enabled = true
}

rule "terraform_unused_declarations" {
  enabled = true
}

rule "terraform_unused_required_providers" {
  enabled = true
}

rule "terraform_workspace_remote" {
  enabled = true
}

pre-commit

Setting up git hooks with the pre-commit framework allows you to automatically run TFLint, as well as many other Terraform code checks, prior to any commit.

Here is a sample .pre-commit-config.yaml that combines Anton Babenko's excellent collection of Terraform specific hooks with some out-of-the-box hooks for pre-commit. It ensures that your Terraform commits are:

  1. Following the canonical format and style per terraform fmt
  2. Syntactically valid and internally consistent per terraform validate
  3. Passing TFLint rules
  4. Ensuring that good practices are followed such as:
    • merge conflicts are resolved
    • private ssh keys aren't included
    • commits are done to a branch instead of directly to master or main
repos:
  - repo: git://github.com/antonbabenko/pre-commit-terraform
    rev: v1.59.0
    hooks:
      - id: terraform_fmt
      - id: terraform_validate
      - id: terraform_tflint
        args:
          - '--args=--config=__GIT_WORKING_DIR__/.tflint.hcl'
  - repo: git://github.com/pre-commit/pre-commit-hooks
    rev: v4.0.1
    hooks:
      - id: check-added-large-files
      - id: check-merge-conflict
      - id: check-vcs-permalinks
      - id: check-yaml
      - id: detect-private-key
      - id: end-of-file-fixer
      - id: no-commit-to-branch
      - id: trailing-whitespace

You can take advantage of this configuration by:

  • Installing the pre-commit framework per the instructions on the website.
  • Creating the above configuration in the root directory of your Git repository as .pre-commit-config.yaml
  • Creating a .tflint.hcl in the base directory of the repository
  • Initialize the pre-commit hooks by running pre-commit install

Now whenever you create a commit, the hooks will run against any changed files and report back issues.

Since the pre-commit framework normally only runs against changed files, it’s a good idea to start off by validating all files in the repository by running pre-commit run –all-files

Conclusion

These approaches help make it easier and safer to refactor Terraform codebases, speeding up a team's "Infrastructure as Code" velocity.

This helped my team gain confidence in making changes to our legacy modules and enabled greater reusability. Standardizing on formatting and validation checks also sped up code reviews. We could focus on module logic instead of looking for typos or broken syntax

December 11, 2021

Day 11 - Moving from Engineering Manager to IC

By: Brian Scott (@brainscott)
Edited by: Don O'Neill (@sntxrr)

Within the past month, I've had a radical change into a new role within my existing employer, for the past decade I was an SRE Manager building teams and a Tech Executive. I hope to summarize my experience including how that made me feel, moving into an IC Role. The thoughts and ideas in this article are from my own opinion and past experiences.

For the past 6-8 years, I've been in an Engineering Manager/TechExec role, specifically in Systems Reliability Engineering. I was comfortable, happy, and engaged in this role, managing multiple SRE teams supporting a wide range of products & platforms in the Enterprise.

Before we dive in deeper, A little history on myself, I've been playing with technology since I was in 5th grade. My English teacher at the time taught me everything he knew about repairing computers, primarily 286's & 386's, DOS, and teaching me the BASIC programming language.

As I transitioned into 8th grade, entering High School, my computer teacher approached me to ask if I wanted to help with administering the School's Network of 12 Windows NT Servers running Active Directory, Exchange & File Services with over 4000 workstations & Printers. Apparently, my 5th-grade teacher passed a few tidbits to him of what I was doing in middle school in Computer Science.

Little did I know after accepting the position that my journey began, A few startups (MySpace, remember that?) and mid-large corporations later, I ended up in Engineering Management, primarily focused on building teams that support large scale applications both On-prem and in the cloud with a focus on delivering solutions with a DevOps culture & SRE mindset.

I've been used to building high-performing engineering teams, meeting new and amazing engineers while focusing on creating T-Shaped teams, this is not necessarily a new concept but one that worked for my teams and worked well. During this time, We have had an amazing leadership team that pushed us to go above and beyond while meeting new product teams across the company every day that needed our help in delivering great solutions. In certain organizations, high technical roles can be treated as semi-management.

We introduced several new technologies & concepts to the company as a whole, developing many Communities of Practice around Config Management, Containers, CI/CD, and even Web Development with Go, and so on. With the vast coverage of different areas that the company was working in, I found myself, slowly moving into a new space that we never had a role in the company, more on this, in just a bit.

Before moving into Management, I was a Staff SRE (Systems Reliability Engineering). You might be thinking, isn’t it Site Reliability Engineering?, yes but different companies tailor the meaning of SRE to meet the needs within their respective areas. In my case, we weren’t just managing Sites & Web Applications but Systems that handle a wide range of products in the Entertainment & Media space. Think Rendering, Control Systems, and safety systems.

As a Manager, I started seeking and making new connections across the enterprise, assisting teams in onboarding the latest technology, whether that be LiDar, Kubernetes, understanding GitOps & Docker, and new tools that were bursting with Innovation in the Open Source space. While being good at helping others and always saying “YES”, I quickly found myself spread quite thin between managing 5 different SRE Teams, each team roughly 3-5 team members, supporting over 3000 Applications and some of which were centralized services for the entire enterprise to consume. It was also getting a little hard for me to stay current with the technology, which I loved.

Leadership quickly saw my success in evangelizing new technology and helping our business units move fast in adopting new methods of engineering not only with new technology but ensuring our SRE’s had the proper tools and was aware of up and coming automation tools to help them reduce toil but also accelerate in how we delivered more value to our customers internally and externally.

My leader called me into a meeting to discuss my interest in moving into an SRE role, but instead of a pure Engineering role, wanted me to pursue leading the company’s effort in evangelising new technology. He went on to explain the value and deep vision in how this would allow me to expand my reach and support more teams in helping create an organization, around Developer Advocacy and mentoring our entire Global SRE Organization to the next level and inspire others in methods such as Empathy Engineering, Automation and best practices in multiple areas, the advancements in what’s next in driving technical leadership.

I was a bit taken back but excited, there was also a bit of nervousness of course, how that might have affected my teams in-relation to my relationships between each one of my engineers. In the next few weeks, my teams and leadership were very supportive and believed that I was needed in this new role to make a bigger impact on the Organization and company as a whole.

Never be discouraged if you find yourself moving into an IC role, new opportunities have a great way of nudging you in the right direction. People often think that moving up the ladder means success but as we all have seen incredible people in IC roles such as Kelsey Hightower at Google or Jessie Frazelle of Oxide Computer. Humans do their best work when positioned to do things they love doing and provided they can reach new heights.

December 10, 2021

Day 10 - Assembling Your Year In Review

By: Paige Bernier (@alpacatron3000)
Edited by: Jennifer Davis (@sigje) and Scott Murphy (@ovsage)

Intro

There are a few moments in my career that I have been struck by a story told with data. When I set out as a Site Reliability Engineer into the big wide world I wanted to capture that data storytelling magic and have adapted a presentation I call the “Year in Review”.

My first company had a tradition of taking a moment to pause and review the year by the numbers. The showstopper was the chart showing the amount of data ingested year over year since the founding.

In a single glance that chart conveyed a story that would take hours to tell!

It communicated the incredible efforts the employees took to scale the system to handle ingesting, processing, publishing and storing an ever increasing mountain of data. It illustrated how far the company had come and we were confronted head on with the realization that “what got you here, won’t get you there”.

The biggest impact I have seen comes after the presentation. Discussions from Year in Reviews have sparked sweeping oncall management changes as well as minor, but important, changes in the way developers engage with the SRE team.

Before diving into implementation details, let’s look at why this type of data storytelling is such a powerful tool by examining the core purpose of SRE

The Mission of SRE

The mission of an SRE team is to improve system reliability by facilitating change.

System reliability is the sum of hundreds of decisions humans make when developing, deploying, and maintaining software systems; it is not an intrinsic property1 of the systems (Patrick O’Connor, 1998). SRE job descriptions tout phrases like “evangelize a DevOps culture” and “influence without authority” acknowledging our roles as change agents.

And as often heard, “change is hard”. As change agents, we are often faced with conflicting priorities, multiple stakeholders internal and external, and fear of the new and unknown.

However, just as often we hear “change is the only constant”. Whether it’s hardware improvements, operating system upgrades, security vulnerability announcements, software dependencies, or the software that we manage as a service, we are constantly monitoring and implementing change.

Combine these two axioms, for extra difficulty:

Ask any engineer who has been forced into a major operating system upgrade when the version of software they’re running requires the previous OS.

As an SRE I often want to make changes across the entire engineering organization such as developing oncall onboarding, ensuring that we are monitoring the customer’s experience, clarifying the lines of responsibility between developers and operators and more!

These types of changes that affect everyone is difficult to effectively implement until two things are true:

  • Is there a shared understanding of the current state?
  • Is there agreement that the current state needs to change?

This does not mean there needs to be consensus on what changes need to be made!

Is there a shared understanding of the current state?

The answer to this can be a resounding “Yes!” after your Year in Review presentation. Here’s why:

Humans learn best from stories, feelings, senses, and opinions commonly known as qualitative data. Focusing only on these exclusively you risk coming to broad conclusions without nuance or context.

Businesses claim to operate on data, facts and figures, or quantitative data. Focusing purely on the numbers you risk having too many details leading to irrelevant rabbit holes.

In fact, the two seemingly disparate viewpoints aren’t at odds at all. You can even validate findings by using the other category of data.

Feel: “Our monitoring sucks, none of the last 5 pages I got were actionable”

Fact: The primary oncall was paged 5 times out of business hours last week

Finding: Team X is getting paged frequently for non-actionable reasons

Hosting a “Year in Review” means weaving a story using the quantitative data about what occurred in your systems with the qualitative “anec-data” from a human perspective to build a foundation to introduce change.

Is there agreement that the current state needs to change?

This is a more complex endeavor - identifying and implementing change is the hard work of collaborating across teams, roles and competing incentives, motives, and needs. Think of “Year in Review” as a springboard for driving discussion and debate to align on “do we agree something needs to change?”

What does this look like in practice?

At a previous company I heard from engineers and managers alike that the oncall rotations were in need of a shake up. This was an excellent starting place where everyone agreed that there was a problem but was having trouble implementing the necessary changes.

With a goal in mind to identify what exactly the oncall issues were my team tailored a “Year in Review” focused mainly on oncall metrics such as alert noise, hours oncall per engineer, pages received per engineer. Slides illustrated the deluge of alert storms no human could possibly investigate in a given shift and were largely unactionable noise. The impact of not addressing this problem was clear, we were likely missing important signals in the noise and oncalls weren’t able to effectively prioritize their time.

After reviewing the data as a group, my team facilitated a brainstorm to address the barriers to changing the rotations:

  • How to handle ownership when multiple teams contribute code?
  • What are the “hot potato” services no one feels comfortable owning?
  • What services are unofficially owned by a single engineer that needs documentation?
  • What is the goal of a low urgency or warning alert?

Based on the main discussion and others in standups and sidebars, my team proposed new team-service ownership and rotations. Several weeks and few rounds of revisions later we merged the PR with our new Terraformed oncall rotations!

DIY “Year in Review”

So, how do you create a “Year in Review” for an SRE team? To start, I typically have a few things in mind about what I think happened and what the data will show. It is fascinating to see where your perception of the system and reality diverge. You can kick off your process by asking a couple of questions:

  • What story are you expecting the data to tell?
  • What changes do you think need to be made in the next year to improve reliability?
  1. Book a meeting with all parties (including engineers, managers, sre, qa, ops, product managers). If there is an existing meeting like an All-Hands or Demo Hour sign up for a presentation slot
  2. Kick off a brainstorming session and have participants list out possible changes to include. Such as new features launched or infrastructure expansions to new regions, or even doubling the organization size.
  3. Ask teams (including managers)
    1. What data they would find interesting
    2. What data they could contribute from their domain
  4. List the company-specific tooling for data sources like:
    1. Version Control
    2. CI/CD
    3. Monitoring
    4. Incident Management
    5. Ticket tracking system
    6. Documentation store
    7. Support ticket system
  5. Enlist the help of others to gather the interesting metrics over the past year or year over year. Some suggestions are:
    1. Noisiest alerts
    2. Number of environments
    3. Oncall engineers
    4. Number of services
    5. Ratio of oncall engineer to number of services oncall for
    6. Age of dependencies/libraries
    7. # of hours oncall per person
    8. Number of features launched
    9. # of after hour pages
    10. Ratio of warning alerts to pages
    11. Number of production deploys rolled up by day
    12. Number of open incident AIs
    13. Ingress traffic or other indicator of system load
    14. Most viewed documentation pages
    15. Most search documentation terms
    16. Time to first PR
    17. ….and so much more!
  6. Slice and dice the data trying out top 10 lists, total sum, or segment by using whatever constructs your company has such as:
    1. Department
    2. Service
    3. Team
    4. Product Feature
  7. Group the data into themed areas “oncall” “production” “onboarding” etc. If you have convinced folks to co-present with you each person can be responsible for presenting a different theme
  8. Assemble into a slide deck with one chart per slide to maximize impact
  9. Hold the meeting and present your findings,
  10. Discuss! In the meeting, after the meeting before the next Year In Review how you interpreted the data compared to others
  11. Publish the data and your queries so everyone can explore and answer their own questions

Parting Thoughts

SREs are uniquely suited to facilitate a Year in Review bringing a system-wide perspective on the people, processes, and technology and mission to improve reliability. Keep in mind that much like effecting change, hosting a Year in Review is not a solo effort!

Going solo means you will only capture YOUR thoughts which will almost certainly be tempered by the unique vantage points from others. The more perspectives you invite, the fuller the story of your system will be.

Please share your favorite data storytelling moments or Year in Review stats with me on Twitter at @alpacatron3000

Citation

O’Connor, P. (1998) Standards in reliability and safety engineering [Article]. Elsevier Science Limited, 9 Dec. 2021.

https://www.sciencedirect.com/science/article/abs/pii/S095183209883010X

Notes


  1. Since the SRE field is still getting established outside of Google, I started to read perspectives from Reliability Engineering in other disciplines. A nugget from Patrick O’Connor’s “Standards in reliability and safety engineering” paper sparked a spicy but important revelation about reliability.

    “Those reliability standards which apply mathematical/ quantitative methods are also based on the inappropriate application of “scientific” thinking. An engineered system or a component has no intrinsic property of reliability, expressible for example as a failure rate. Truly scientifically based properties of systems and components include mass, power output, etc., and these can therefore be predicted and measured with credibility. However, whether a missile or a microcircuit fails depends upon the quality of the design, production, m~nten~ce and use applied to it. These are human contributions, not “scientific”. “ 

December 9, 2021

Day 9 - 3 things parenting taught me about system administration

By: Jennifer Davis (@sigje)

The last five years have been grounding for me as I became a beginner at parenting. In this article, I want to share three things I learned about being a better sysadmin from being a mom.

Prioritize your health

Of course, I've heard it so many times. But in the rush of trying to support the "system," sometimes, I lose track of the little things (getting enough sleep, eating meals, human engagement that isn't predicated on deliverables and action items). When it comes to parenting, I see the difference in how the necessities of the moment can gradually subsume the primary goals and real joy* (a secondary outcome of successful parenting that I tend to only enjoy in retrospect, after having assured myself that my internal parenting kanban board is as it should be–obsession, exhaustion, and then joy tends to be my experiential flow as a parent).

Prioritizing health - if I'm not ok, I'm not able to handle the "system" as well, regardless of its state.

Any parent of a child under five will tell you that 90 percent of the job is keeping the child alive. If they make it to the next day, smile and giggle the proper number of times per day, and if your friends, family, and parenting peers seem unaware that your parenting path bears a concerning resemblance to the plot of the movie Speed, then you're more or less gravy. You also learn that, while you can spend a great deal of time analyzing and conversing about your child and how they're faring, the main thing is to put them in the right places at the right time. Sunshine, exercise, the company of their peers, easily accessible bathrooms–these are the things that matter. If my son doesn't get direct sunlight within 90 minutes of walking, his mood takes a nosedive, and this isn't a mystery to me. Likewise, if he isn't let loose at the park to terrify small woodland creatures with his desire to befriend them, his attentional resources will be suboptimal when it's time for flashcards. Yet I (and I don't think I'm alone in this) will frequently wake, obtain caffeine, have a quick all-hands with my family, and proceed to sit in a small room staring at a screen for eight hours straight. As a result, my ability to practice self-care myself fails regularly.

Leverage the community

To prioritize my health, I have to ask for help. I've had the following experience again and again professionally, and as a parent, and at some point, I hope that it won't astound me, which it does every time: I believe that I'm having a singular experience (which, of course, we all are) and that I am an outlier because obviously no one else is concerned about the state of affairs or struggling. And then someone else gives voice to the precise issue that I've devoted considerable resources to NOT sharing. Of course, other people are also concerned about the children pretending that the scissors are boomerangs. One of my primary errors is thinking that there is some scorekeeping of tracking the social currency and categorizing discourse into the buckets of "I helped" and "I was helped." It's a binary that renders engagements as transactional when my actual community experience is almost always that I walk away feeling better regardless of who broached a topic.

You can't eliminate all Snowflakes

Within the community, we often talk about snowflakes as problems. Yet, as a parent, you discover that there are no handbooks for YOUR kid because every child is different in their own beautiful, hard, and surprising way. Likewise, while there is value in the community and sharing stories, every system will be different. You work with one system, you've learned about that system, and while there are useful things you'll learn from that system to apply to other systems, every system will be beautiful, different, and hard in its surprising ways.

Wrapping Up

Our industry is constantly evolving with the introduction of new technology, tools, and processes. It may feel overwhelming to try to understand everything. You have to accept some degree of the unknown. When I first became a parent, I realized that Operations had prepared me for the inevitable changes that occur every single day. No matter what tomorrow brings, the essential skills are learning to adapt to change and learning to learn fast.

Please make time for yourself, connecting with the community, and accepting what is different and unique about your systems and the environments they are running in.