December 7, 2010

Day 7 - Website Performance Optimization

This article was written by Bob Feldbauer (@bobfeldbauer)

Optimizing website performance can dramatically increase conversions and loyalty, and decrease costs. Although it may be traditionally viewed as a responsibility of developers, the reality is that sysadmins are also often asked to work on website performance optimization.

The following is intended as a busy sysadmin's "crash course" in optimizing website performance.

As with trying to optimize any process, you should establish a baseline to measure any changes against. Install the Firebug Firefox plugin and Yahoo!'s YSlow add-on to measure your initial performance and verify improvements as you make changes. To see performance changes over time from a consistent external source, you can use free tools like Pingdom's Full Page Test or Octagate's SiteTimer. Also, Google's Webmaster Tools shows optimization suggestions based on the Page Speed tool, and crawl stats for the average time spent downloading a page from your site.

Yahoo!'s research shown in the table below shows 62-95% of the time required to load a page is spent making HTTP requests for non-HTML components like images, scripts, and stylesheets. See the following table for the time spent loading HTML vs non-HTML components for popular websites:

Site Time Retrieving HTML Time Elsewhere
Yahoo! 10% 90%
Google 25% 75%
MySpace 9% 91%
MSN 5% 95%
eBay 5% 95%
Amazon 38% 62%
YouTube 9% 91%
CNN 15% 85%

As the table indicates, reducing the number of HTTP requests can provide one of the biggest increases in performance. Aggregating CSS and JavaScript into as few files as possible and using CSS Sprites are two ways to reduce the number of HTTP requests.

In addition to reducing the number of HTTP requests, being able to load scripts in parallel instead of serially can improve performance. A newly developed tool called Head JS can be used to load JavaScript scripts in parallel, while retaining execution order. This allows scripts to load without blocking other components from loading.

Most sites include static files that change infrequently (CSS, images, JavaScript, etc) and can benefit from appropriate HTTP caching. See the Google's Page Speed team's guide to HTTP caching for more information.

Another important step in website performance optimization is configuring your web or application server to deliver gzip compressed content. On typical sites, gzipping content reduces text size by 75% and total size by 37%.

In addition to gzip compression, making images, scripts, and CSS files smaller also helps - especially when loading a site on lower bandwidth connections like mobile devices. Even if you gzip scripts or CSS files, you can "minify" them to further reduce their size by 5% or more. Yahoo!'s YUI Compressor can minify both CSS and JavaScript, while Yahoo's Smush.it can optimize image sizes without losing quality.

Although there are many other things you can do to optimize website performance, this "crash course" in optimization should get you started.

Further reading:

  1. Yahoo!'s Exceptional Performance team's
  2. Web Performance Best Practices by Google's Page Speed team

December 6, 2010

Day 6 - Aggregating Monitoring Checks for Better Alerts

This article was written by Jordan Sissel (@jordansissel)

Chances are that your infrastructure has more than one machine performing the same role - frontend (webapps, etc), backend (databases, log collectors, etc), middleware (message brokers, proxies, etc), support services (config management, etc). Horizontal scaling means that you scale by adding more server resources, right?

Monitoring a horizontally scaled system can often lead to unintended noise. You might have 10 web servers, but 3 are broken, so you get 3 alerts. Maybe you monitor ssh health on all 50 of your servers, and someone pushed a bad config or there is a bad network connection, and now all 50 servers are alerting you about failures. Further, I believe that monitoring alerts (things that page you) should generally be business-oriented, not single-metric-and-single-server-oriented.

Even if you aren't running systems with duplicate roles, it often makes sense to collect multiple individual health checks into a single alert.

This calls for aggregating your data. Benefits of aggregation are increased alert value while decreasing alert noise. Noisy monitoring systems often result in yourself (and others) unconsciously training to ignore that system - don't let your monitoring servers cry, "Wolf!". Further, alerting on aggregates means you can do cool things like only alerting if, for example, more than 5% of things are failing - assuming that's safe for your business.

If you could keep the existing checks you have, not alert on them, but add aggregate checks that cause alerting, you could maintain your current fine-grain monitoring while improving alerting in both noise level and business relevance! Sounds like win-win.

There are some solutions for this already, like check_multi. but I didn't want to run additional or duplicate checks. Why? Some checks may take a long time (like a complex Selenium test), or may be resource-intensive to run (like verifying a large backup), or may not scale if I have to run 200 of them to answer one aggregated health check.

So, I took a different approach. Nagios already records state in a file on disk, so we can parse that file and produce an aggregate check. Lucky for me, there are already tools that parse this format, so most of the work is done already (nagiosity, checkmk_livestatus, and ruby-nagios). I picked ruby-nagios, for no particular reason. It didn't require much hacking to add what I needed. The result is nagios-manage and a tool: check_check.rb (comes with the nagios-manage rubygem).

Notes: Currently, this tool assumes a few things about what I want:

  • Skips checks that have notifications disabled
  • Skips checks that are marked in downtime
  • Only uses the hard state. If it is in soft critical, for example, it will assume the previous hard state.

The above constraints let me aggregate other nagios-state data into health that is deemed important - if one server is down for maintenance or has a known failure, I don't want to alert about it.

Examples:

# Summarize all checks for all hosts:
% check_check.rb
OK=110 WARNING=0 CRITICAL=0 UNKNOWN=0 services=// hosts=// 

# Summarize solr checks, when one check is failing:
% check_check.rb -s solrserver
OK=27 WARNING=0 CRITICAL=1 UNKNOWN=0 services=/solrserver/ hosts=// 
Services in CRITICAL:
  frontend1.example.com => solrserver client tests

The result in nagios looks something like this:

nagios check_check

By the way, the no-argument invocation is super useful for, from the command line, checking the overall health of everything nagios monitors.

For the solrserver check above, I would create one single check that would run the above check_check.rb command and alert appropriately. This saves me from having 28 potentially-failing-and-alerting checks. Further, if I get an alert about 1 critical check, I still have the further fine-grained alerting per server, so I can easily drill into what is failing.

Summarizing: I still have monitoring doing fine-grained, individual checks, like cpu usage, network activity, server behaviors, etc, but individual checks do not cause alerts themselves. This means setting the contacts for your individual checks to something that won't alert you. Instead, I use check_check.rb to aggregate results to reduce noise and to collect relevant data - alerting only on important failures in a way that doesn't flood the pager and helps me better indicate business-service problems to those on call.

December 5, 2010

Day 5 - Why Aren't You Doing Code Reviews?

This article was written by Phil Hollenback and is @philiph on Twitter.

I have to admit: I'm on the fence about the devops movement. However, I do think there are a lot of good ideas to be found in the 'devops culture'. One idea I particularly like is that sysadmins should think more like developers. I might be partly attracted to that philosophy because I have a CS degree. However, I also think it's logical because developers have spent a lot of time figuring out development workflows (duh). With the increasing automation in system administration, it's natural that we as sysadmins should follow the same process. Whether we like it or not, we will all be writing more code in the years to come as we increase our use of automation.

I hear that developers are all het up about Agile programming these days. I don't know a lot about that whole methodology either, but I have found some good ideas from skimming the literature. One idea that really excites me as a sysadmin is the notion of code review. Someone once said something like, "with enough eyes, all bugs are shallow" and that is exactly what code review accomplishes. My group has embraced code review as an operational concept and it has greatly increased the quality of our work. Thus, I'm here to spread the word: everyone should be doing code review on any scripts, programs, or text config files destined for production.

THE TOOLS

In my workplace our code review tools are Bugzilla, Subversion, and Review Board. There are other code review products out there but we already had Review Board (http://www.reviewboard.org) set up so it was an obvious choice. This process is tool-agnostic: you could use any combination of version control, bug tracker, and code review if you wanted.

The first step in the process is to create a tracking bug. In my organization we say "if there isn't a bugzilla, it doesn't exist". Don't waste my time with an email thread. The bug will be used for all subversion commit messages and will be referenced in the review board posting. We use a subversion post-hook that requires all log messages to include a bugzilla reference to help enforce this.

Once you have the bug/ticket/issue, you check the existing files out of subversion and make your changes. Note that we have a lot of YAML-formatted text config files that we keep in subversion as well, so we use code review for changes to those as well.

Now you have a subversion diff you can submit to Review Board. You might want to run 'svn diff' to sanity check your diff before submitting. If you like what you see, submit your code review like this (from your subversion working directory):

$ post-review -p --bugs-closed 12345 --description "fix fencepost error" \
  --summary "system healthcheck scripts" --target-group sysadmins

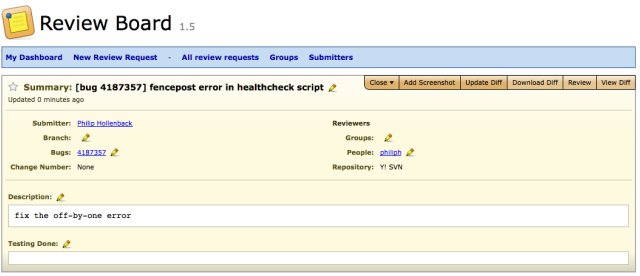
The above will create your code review, publish it, and reference the bugzilla from the first step. It will also send an email out to the 'sysadmins' group which you've already configured in Review Board. That email contains a link to the review in Review Board. Here's what the main screen for a pending code review request looks like:

review main screen

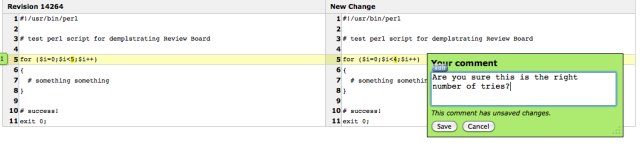
The next step is up to the reviewers. Typically you will send a code review to a group of reviewers, and wait for any one of them to sign off on your review. Review Board allows reviewers to make general comments about all the diffs in a review, and/or comments on specific line numbers.

Viewing the diff for a change:

view the diff

Adding a comment to a specific line number:

adding a comment

Once a reviewer is satisfied with all their comments, they publish their review so you can see it. They can either select the 'ship it!' button or leave it unchecked, depending on whether or not they feel your changes are acceptable. If the reviewer doesn't check 'ship it!', the expectation is that you will fix the problems and submit another review request. Review Board supports review revisions via using the '-r' option to post-review, so you don't need to create multiple review requests.

ship it

Continue this iterative process for adjusting your code until your reviewer signs off by checking the 'ship it!' button on their review. Congratulations, you now have a code review change! Go check it in to subversion and prepare for deployment.

WHY DO ALL THIS WORK?

While the effort to generate code review is not terribly substantial, it does complicate your workflow. Why do this at all? One simple reason: it makes your code or config files better! This is due to several reasons:

  1. If you work in an environment where code review is the norm, you unconsciously write better code because you know someone is going to look at it. Maybe it doesn't always work out that way, but I know I stop myself form doing sloppy things if I know someone is going to critique my work.
  2. Code review serves as a final check to catch stupid mistakes. You are blind to dumb typos in your own code. Other reviewers tend to find them with much more regularity. This is largely because they don't know the flow of your code so they have to look through it all carefully.
  3. Code review serves as a barrier for, lets say, "less experienced" peers. You all know what I'm saying here. Often people are afraid to admin they don't know how to fix some problem assigned to them. Solution? Take a best guess shot in the dark and pray it works. My classic example: I asked a sysadmin once to randomize his cronjob running on many servers as to not overload a particular service. He did the work and we put the new script into production on several thousand machines. Then we started seeing regular overloads on the service in question at the same time every hour. When we inspected the randomized code, we found the sysadmin had picked a random time delay value and then used THE SAME VALUE on every host. If you don't do code review you don't find problems like this.
  4. A real benefit that should not be overlooked is that code review can be an incredible learning tool for both junior and senior sysadmins. Junior sysadmins need to learn about everything so your feedback helps them immediately. The effect with senior sysadmins is more subtle. We are creatures of habit and develop our coding techniques early in our career. Tools evolve and we often don't bother to follow up on advancements. If someone else reviews your code, that gives them an opportunity to suggest better approaches to problems. This can be a real eye-opener if you haven't read the manuals in a while.
  5. Code and configuration style and quality can be enforced. If you have a style guide (you should!), you can use code review to both enforce style and educate about style. You can enforce code-style spacing, usage, etc, and also enforce larger concepts like requiring tests for each change, etc.

One thing to keep in mind is that code review is actually easier and less time-consuming for sysadmins than for developers. Developers write code all the time, and they write a lot of code. Sysadmins typically perform many duties besides writing scripts, and thus the amount of review work is correspondingly reduced. In our experience in a group of 6 people, code review create a minimal amount of overhead.

CONCLUSION

I'm here to tell you that code review works, and it works particularly well for system administrators. Formalized code review is a rising tide that lifts all boats - we all write better code and configurations when others look at it. Review Board in particular provides a fairly simple and lightweight way to implement code review. Code review is your first line of defense in many ways. When a script breaks in production, the first thing I say is, "was it code reviewed"?

Everyone knows that question is going to be asked so we plan accordingly and write better code. I'm not talking about large coding projects here either - even the simplest of scripts should be code reviewed. In fact, small scripts can benefit the most because those are the ones you are most likely to write quickly and carelessly. So please take my recommendations to heart - implement a code review culture for system administration. It will have a measurable effect on your team's performance and will definitely reduce production outages.

Further reading:

December 4, 2010

Day 4 - Make sense of Perfmon with PAL

This article was written by Sam Cogan (@samcogan)

You've got a performance problem: your Windows server or application isn't performing as well as it should. You need to find out why. When Task Manager isn't enough it's quite likely you'll reach for Perfmon.

If you don't know already, Perfmon is the Windows performance monitor. It can be found under administrative tools on all versions of Windows from Windows 2000 onwards. It provides a way to monitor counters - metrics of your system performance, such as %CPU use, Free Memory etc. Many Windows applications come with their own custom set of counters for their specific application. We can use perfmon to setup sets of counters (Data Collector Sets) to collect data and to allow easy re-use. Once we have created a collector set we can start logging. We can leave it running however long we like, then come back and review the data. Perfmon also provides some step by step wizards to help the beginner start using it quickly.

For more information on using Perfmon, see this article

Perfmon is an excellent tool for collecting data. The problem comes when trying to analyse this data. Often, when we're not sure what the problem is, we'll add a wide range of counters to make sure we've covered all areas. Very quickly we've collected a large amount of data about the performance of the problem machine or machines.

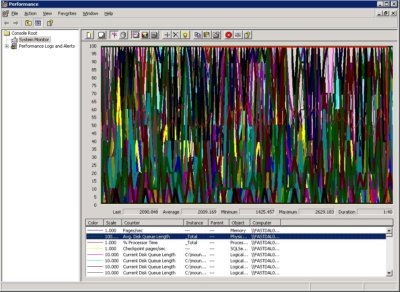
Chances are that if you open up these files in Perfmon, then you'll end up with a selection of lines on a graph, information that seems like it should be useful, but is often hard to decipher what it actually means and if you have a lot of counters you can end up with a mess of colour lines that make a nice picture, but has no meaning whatsoever!

Perfmon Screenshot

What do we do? How do we get some useful information that will help us solve this tricky performance problem?

Yes, you could go through and filter out the lines you don't need. What you really need is a way to give meaning to these lines - to see what is normal or abnormal, or to simplify the data or change its presentation into something more digestable. This is where PAL comes in.

PAL

Perfromance Analyis of Logs or PAL is a tool written by Clint Huffman at Microsoft, to assist in analysing Perfmon logs and to produce an HTML report that will provide detailed graphs, and indications of where a problem may lie. It provides a simple GUI to a complex Powershell script that actually does most of the work.

To understand how to use PAL, we need to look at it's 4 main components

  1. The Log file
  2. The Threshold File
  3. Questions
  4. The End Result

So, let's download PAL, fire up the GUI, and get to work!

Log Files

The Perfmon log file is where all PAL looks for data. A key advantage to using PAL is that you do not need to consider log size when you look at collecting your data. You can include all the counters you might need, and then instruct PAL to only analyse the ones you want and only during a specific time period. The only caveat to this is that PAL will not work as well if you have multiple computers feeding a single log file, as it will assume that the configuration of the machine is the same for each counter.

So, tell PAL where you log file is, and specify a time range for the data you want to analyse if you don't want to look at the whole file (if you have multiple files, we can add them later).

Threshold file

The threshold file is what makes PAL a useful tool. In essence, it's just a simple XML file used to define what kind of analysis you want PAL to do on your log files.

The first thing this file does is to define what counters you want to analyse, meaning you can skip any counters that you're not interested in or don't apply to your current problem.

Next, and the reason it is called a threshold file, it lets you set thresholds on each of your counters. This allows us to add some meaning to the data we have collected. We can define what value for each counter defines a warning state and what defines a critical state and so bring potential problems to our attention.

Finally, the threshold file allows you to specify questions to ask. We will come on to these shortly.

This may sound like a lot of work, but it doesn't have to be. PAL has a number of threshold files included that cover many of the common server configurations, e.g. Exchange, OCS, SQL, and a catch all, systems overview file. Using these built in threshold files, or by downloading additional ones from the Internet you can make extensive use of PAL without ever needing to write any code.

If these threshold files do not meet your needs, or you need one that is tailored to your needs, then PAL includes a GUI that assists you in doing just that. Selection of counters is done via the user interface. However, the calculations used to determine threshold values are written in Powershell, so some ability to write Powershell code is required.

PAL Screenshot

If you haven't yet collected your Perfmon data, you can also use PAL to generate a Perfmon template from a threshold file, so that you only collect the data that this threshold file will generate.

Questions

The questions section asks you for some extra information about the machine this Perfmon log is for, for example number of CPU's, amount of memory etc. These questions are important, because the values you give can be accessed in the Powershell code inside the threshold files. These values can be used to assist in calculating your threshold levels.

Questions are configured inside the threshold file, and can be edited and added through the PAL GUI when creating a threshold file. When you add a question you create a Powershell variable that is available for use later inside threshold calculations.

Running the Analysis

Once you have selected your log, your threshold file, and answered some questions, you are ready to go. At this point, you add your job to the queue. You can then choose to either run this queue now or queue up more jobs to run in a batch. PAL analysis jobs can take a number of hours to run, depending on how much data is contained in your logs, so it is often convenient to queue up jobs to run overnight.

Ok! So, you've run your analysis and PAL has spat out some HTML files, how are these useful?

First off, for those in a rush or who want a quick overview of what problems there may be, there is the alerts section. This looks at the threshold values we had in our threshold file, and gives a visual indication of what areas of this log are in a warning, or critical state. It's very easy to quickly see where the machine is struggling, and where you may want to focus your efforts on fixing the problem.

html output

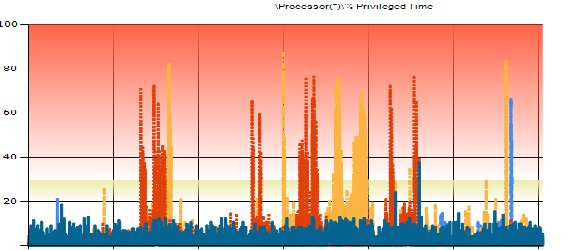
Once you've been through all your alerts, we then have detailed information on all your selected counters. Each counter is presented separately, with a graph, alert details and statistics. Threshold data is also presented on each graph, allowing us to quickly see at what point there was an issue and how severe it was.

graph example

As you can see from this graph, this job is making the CPU a little unhappy at times and might be something that needs to be looked at!

Summary

Perfmon is a great tool for collecting performance data, but it sucks when it comes to actually analysing this data and getting some meaning from it. What looks like a big spike in the Perfmon viewer could actually be normal operation for that counter - we're missing some helpful context. We can use PAL to give us information that is not only easier to read but also has some meaning to it. From this, we can determine which data is normal and can safely be ignored, and which data is anomalous and is something that we need to investigate.

PAL is by no means perfect; getting useful reports out of this tool relies on having a threshold file that covers the counters you need to analyse with meaningful threshold calculations. If one of the included files, or one found on the internet covers this then that's great, but if not you are stuck needing to write your own using Powershell, which can be quite a complex task if you have lots of counters you want to analyse.

Users who need to analyse perfmon data alot will invest the time in customising their threshold files to get out exactly what they need, however more casual users are going to rely heavily on the pre-constructed files.

That said, more and more product areas are seeing the value in PAL and providing threshold files for their products, Exchange and OCS are two examples of this. There's no magic pixie dust in these threshold files. If you can understand Powershell, then you can write your own to handle any Counter that Perfmon can use, including third party ones. So it's a great option for people who need to analyse uncommon data. It's also open source, so if you want to see how the Powershell code behind the analysis, you can.

It's also not a quick process; log analysis can take hours. If you're looking for an immediate answer to your problem then you are going to have to use other methods of getting your answers.

If, however, you've got the right threshold file, and the time to run the analysis, then this can prove an invaluable tool to help you get meaning, and ultimately solve your problems, from Perfmon data.

Further reading:

December 3, 2010

Day 3 - Debugging SSL/TLS With openssl(1)

This article was written by Adam Fletcher

The target audience of this post is the working sysadmin who has setup SSL for a web server such as Apache. If you haven't done this, I'd suggest you take a look at the links on the bottom of this post. Additionally, the information here is useful for debugging the SSL pieces of puppet, syslog-ng, rsyslog, activemq, etc.

I'm going to focus on how to use openssl(1), the command line tool that ships with OpenSSL, to examine SSL connections and debug common SSL problems. I'm going to run my commands on Ubuntu Linux 9.10 with the openssl package and the ca-certificates package installed. OpenSSL should be installed on your system by default (Linux, OS X, FreeBSD, etc), but you'll probably need to install the ca-certificates package (or similar). OpenSSL is also available for Windows and with a small amount of work the commands I use below will work under Windows.

I'll use the term SSL throughout this article to indicate TLS or SSL.

Using openssl as a client

Here's what connecting to www.google.com over SSL with openssl looks like:

adamf@kid-charlemagne:/usr/lib/ssl/certs$ openssl s_client -connect www.google.com:443 -CApath /usr/lib/ssl/certs
CONNECTED(00000003)
depth=2 /iiUS/O=VeriSign, Inc./OU=Class 3 Public PrimaryeCertification nuthority
verify return:1
depth=1 /C=ZA/O=Thawte Consulting (Pty) Ltd./CN=Thawte SGC CA
verify return:1
depth=0 /C=US/ST=California/L=Mountain View/O=Google Inc/CN=www.google.com
verify return:1
---
Certificate chain
0 s:/C=US/ST=California/L=Mountain View/O=Google Inc/CN=www.google.com
i:/C=ZA/O=Thawte Consulting (Pty) Ltd./CN=Thawte SGC CA
1 s:/C=ZA/O=Thawte Consulting (Pty) Ltd./CN=Thawte SGC CA
i:/C=US/O=VeriSign, Inc./OU=Class 3 Public Primary Certification Authority
---
Server certificate
-----BEGIN CERTIFICATE-----
MIIDITCCAoqgAwIBAgIQL9+89q6RUm0PmqPfQDQ+mjANBgkqhkiG9w0BAQUFADBM
MQswCQYDVQQGEwJaQTElMCMGA1UEChMcVGhhd3RlIENvbnN1bHRpbmcgKFB0eSkg
THRkLjEWMBQGA1UEAxMNVGhhd3RlIFNHQyBDQTAeFw0wOTEyMTgwMDAwMDBaFw0x
MTEyMTgyMzU5NTlaMGgxCzAJBgNVBAYTAlVTMRMwEQYDVQQIEwpDYWxpZm9ybmlh
MRYwFAYDVQQHFA1Nb3VudGFpbiBWaWV3MRMwEQYDVQQKFApHb29nbGUgSW5jMRcw
FQYDVQQDFA53d3cuZ29vZ2xlLmNvbTCBnzANBgkqhkiG9w0BAQEFAAOBjQAwgYkC
gYEA6PmGD5D6htffvXImttdEAoN4c9kCKO+IRTn7EOh8rqk41XXGOOsKFQebg+jN
gtXj9xVoRaELGYW84u+E593y17iYwqG7tcFR39SDAqc9BkJb4SLD3muFXxzW2k6L
05vuuWciKh0R73mkszeK9P4Y/bz5RiNQl/Os/CRGK1w7t0UCAwEAAaOB5zCB5DAM
BgNVHRMBAf8EAjAAMDYGA1UdHwQvMC0wK6ApoCeGJWh0dHA6Ly9jcmwudGhhd3Rl
LmNvbS9UaGF3dGVTR0NDQS5jcmwwKAYDVR0lBCEwHwYIKwYBBQUHAwEGCCsGAQUF
BwMCBglghkgBhvhCBAEwcgYIKwYBBQUHAQEEZjBkMCIGCCsGAQUFBzABhhZodHRw
Oi8vb2NzcC50aGF3dGUuY29tMD4GCCsGAQUFBzAChjJodHRwOi8vd3d3LnRoYXd0
ZS5jb20vcmVwb3NpdG9yeS9UaGF3dGVfU0dDX0NBLmNydDANBgkqhkiG9w0BAQUF
AAOBgQCfQ89bxFApsb/isJr/aiEdLRLDLE5a+RLizrmCUi3nHX4adpaQedEkUjh5
u2ONgJd8IyAPkU0Wueru9G2Jysa9zCRo1kNbzipYvzwY4OA8Ys+WAi0oR1A04Se6
z5nRUP8pJcA2NhUzUnC+MY+f6H/nEQyNv4SgQhqAibAxWEEHXw==
-----END CERTIFICATE-----
subject=/C=US/ST=California/L=Mountain View/O=Google Inc/CN=www.google.com
issuer=/C=ZA/O=Thawte Consulting (Pty) Ltd./CN=Thawte SGC CA
---
No client certificate CA names sent
---
SSL handshake has read 1772 bytes and written 307 bytes
---
New, TLSv1/SSLv3, Cipher is RC4-SHA
Server public key is 1024 bit
Secure Renegotiation IS supported
Compression: NONE
Expansion: NONE
SSL-Session:
    Protocol  : TLSv1
    Cipher    : RC4-SHA
    Session-ID: 19C0B820C3375AC22DC23A931B07AAB2C875044855060D792B48FBC26936973C
    Session-ID-ctx: 
    Master-Key: 4E40947E5C3F6696951705A4BB5DD19F77EE6AC2AC83D963CE3278742AC14083EA78541C43DA85F5A05CE61977533A31
    Key-Arg   : None
    Start Time: 1290965727
    Timeout   : 300 (sec)
    Verify return code: 0 (ok)
---

In the following examples I won't be pasting the whole output of the openssl command because they'll look much like the one above. Instead, I'll post the parts that matter.

The s_client argument to openssl puts openssl into client mode, and -connect tells openssl which host and port to connect to (top-level arguments to the openssl command have no dash, but subarguments do, and note that -help is a subargument to most top-level arguments that will give you more details on the top-level argument).

The final argument, -CApath, is perhaps the most interesting. The -CApath is the location of all of the CA certificates that the client trusts (note that this path may be different on different Linux distributions, and is provided by the 'ca-certificates' package in Ubuntu 9.10). SSL works on a chain of trust, meaning that the client trusts that the server is who the server says it is because a third party has verified the server's identity.

This third party is the "Certificate Authority" (CA) and the way that this trust works is that the CA has its own public certificate which every client has a copy of (we'll call this the 'CA certificate'. Your web browser comes with a set of trusted CA certificates that the web browser uses to verify that servers like www.google.com and www.amazon.com are who they say they are during an SSL-secured session. In the command above we're telling the openssl command to look for those trusted certificates in the directory given to the -CApath argument.

If we didn't do this, you'd see the string verify error:num=20:unable to get local issuer certificate in the output of openssl:

adamf@kid-charlemagne:~$ openssl s_client -connect www.google.com:443
CONNECTED(00000003)
depth=1 /C=ZA/O=Thawte Consulting (Pty) Ltd./CN=Thawte SGC CA
verify error:num=20:unable to get local issuer certificate
[...]
    Verify return code: 20 (unable to get local issuer certificate)

A CA certificate doesn't look any different from the certificate you setup in your web browser; it is just a certificate that the client trusts. Your server certificate is trusted by a client because that CA has digitally signed your server's certificate. When the server sends the client the server certificate the client can extract which CA certificate was used to sign the server certificate from the server certificate, and the client will then find the CA certificate in the client's collection of CA certificates. The client uses the matching CA certificate to verify the digital signature on the server certificate, and if it matches, the client will trust that the server is who the server says it is.

Self-signed certificates

Instead of connecting to www.google.com, let's connect to our own server, which has a self-signed certificate. The only thing we'll change is the host name in the -connect argument:

adamf@kid-charlemagne:/etc/apache2/sites-enabled$ openssl s_client -connect kid-charlemagne:443 -CApath /usr/lib/ssl/certs 
CONNECTED(00000003)
depth=0 /CN=kid-charlemagne
verify error:num=18:self signed certificate
verify return:1
[...]
    Verify return code: 18 (self signed certificate)

When debugging a problem it is useful to have a reference state for working, which is the request to Google, and reference state for a problem we understand, which is the above request to server with a self-signed certificate. openssl knows that our certificate is self-signed because the certificate's issuer is the same as the certificate's common name.

It's useful to know that openssl indicates most problems in the first few lines of output and again in the Verify return code line. I'll often paste just those lines in the example output below.

I want to run multiple SSL-encrypted virtual hosts on one IP address, but it isn't working!

Typically this means that you've setup multiple named-based virtual hosts in your web server, given them all different certificates but the same IP address and port. This won't work; you'll end up getting the same certificates for all the sites and the client will complain that the server's common name doesn't match the host name.

SSL works at the socket layer, so only one server certificate can be given out per IP address-socket pair (TLS has a mode which allows this as specified in RFC 4366, but this mode isn't in wide use). In order to do what you'll want you need to get a wildcard certificate, which is a certificate with a common name of *.<yourdomain>.com. These certificates tend to cost more and are only available from some CAs. In the past, some browsers rejected wildcard certs, but I've not seen a modern browser reject a wildcard certificate from a trusted CA. If you don't use a wildcard cert, you can't serve multiple virtual hosts inside your domain on one IP-socket pair. Note that wildcard certs only work inside one domain, so you can't server multiple domains under SSL with only one IP-socket pair no matter what.

OpenSSL says it can't get the local issuer certificate!

As an alumni of Computer Science House I have this problem when using their services:

adamf@kid-charlemagne:~$ openssl s_client -connect www.csh.rit.edu:443  -CApath /usr/lib/ssl/certs 
CONNECTED(00000003)
depth=0 /C=US/ST=New York/ieComnuter Science House/OU=OPComm/CN=*.csh.rit.edu
verify error:num=20:unable to get local issuer certificate
verify return:1
depth=0 /C=US/ST=New York/O=Computer Science House/OU=OPComm/CN=*.csh.rit.edu
verify error:num=27:certificate not trusted
verify return:1
depth=0 /C=US/ST=New York/O=Computer Science House/OU=OPComm/CN=*.csh.rit.edu
verify error:num=21:unable to verify the first certificate
verify return:1
[...]
    Verify return code: 21 (unable to verify the first certificate)

This means that you don't trust the CA who signed the server's certificate. For sysadmins, this case often comes up in corporate infrastructures that have their own CA and distribute that CA's cert to web browsers, and you need to connect to a server that uses a cert issued by that CA with something other than a web browser.

You'll need to find out where you can get a copy of the CA certificate used to sign the server certificate and then tell your script to trust that CA certificate. In the case above, once I download the CA certificate from Computer Science House, I can tell openssl to trust it with the -CAfile option:

adamf@kid-charlemagne:~$ openssl s_client -connect www.csh.rit.edu:443  -CApath /usr/lib/ssl/certs -CAfile ./CSH-CA-cert.crt 
CONNECTED(00000003)
depth=1 /O=Computer Science House/OU=OPComm/emailAddress=sysadmin@csh.rit.edu/L=Rochester/ST=New York/C=US/CN=OPComm
verify return:1
[...]
    Verify return code: 0 (ok)

I bought a certificate from a CA but my users don't trust it!

This could be that your CA is shady and isn't really a trusted CA, but it is most likely that your CA requires you to provide an additional set of certificates (often called 'intermediate certificates') to the user to build an unbroken chain of trust; what this means in practice is that your forgot to install all of the certificates given to you by your CA. Check to see if your CA has asked you to download a 'CA bundle' or similar; this bundle will have a few certificates inside the file that you'll need reference in your SSL config (In Apache 2.x with mod_ssl, this is the SSLCertificateChainFile directive).

For example purposes, I've created my own CA and intermediate CA. Without the correct CA bundle:

adamf@kid-charlemagne:~$ openssl s_client -connect kid-charlemagne:443 -CApath /etc/ssl/certs -CAfile CA/demoCA/cacert.pem 
CONNECTED(00000003)
[...]
depth=0 /C=US/ST=Massachusetts/L=Boston/O=A Different Example Company/OU=IT/CN=kid-charlemagne/emailAddress=kid-c@example.com
verify error:num=21:unable to verify the first certificate
verify return:1
[...]
    Verify return code: 21 (unable to verify the first certificate)

OpenSSL can't verify the server certificate because it missing a certificate in the trust chain. The missing certificate is the intermediate CA certificate.

After we've added the CA bundle to our Apache config, you can see everything works:

adamf@kid-charlemagne:~$ openssl s_client -connect kid-charlemagne:443 -CApath /etc/ssl/certs -CAfile CA/demoCA/cacert.pem 
CONNECTED(00000003)
depth=2 /C=US/ST=Massachusetts/O=Fake CA Inc./OU=IT/CN=FakeCA/emailAddress=ca@example.com
verify return:1
depth=1 /C=US/ST=Massachusetts/O=Fake CA Inc./OU=Development/CN=IntermediateFakeCA/emailAddress=intca@example.com
verify return:1
depth=0 /C=US/ST=Massachusetts/L=Boston/O=A Different Example Company/OU=IT/CN=kid-charlemagne/emailAddress=kid-c@example.com
verify return:1
---
Certificate chain
0 s:/C=US/ST=Massachusetts/L=Boston/O=A Different Example Company/OU=IT/CN=kid-charlemagne/emailAddress=kid-c@example.com
i:/C=US/ST=Massachusetts/O=Fake CA Inc./OU=Development/CN=IntermediateFakeCA/emailAddress=intca@example.com
1 s:/C=US/ST=Massachusetts/O=Fake CA Inc./OU=Development/CN=IntermediateFakeCA/emailAddress=intca@example.com
i:/C=US/ST=Massachusetts/O=Fake CA Inc./OU=IT/CN=FakeCA/emailAddress=ca@example.com
2 s:/C=US/ST=Massachusetts/O=Fake CA Inc./OU=IT/CN=FakeCA/emailAddress=ca@example.com
i:/C=US/ST=Massachusetts/O=Fake CA Inc./OU=IT/CN=FakeCA/emailAddress=ca@example.com
[...]
Verify return code: 0 (ok)

My users are reporting my certificate is expired, but it isn't!

We can examine the expiration details of our server's certificates with openssl by piping the output of the command we used above to openssl with the x509 and the -text option.

adamf@kid-charlemagne:~$ openssl s_client -connect www.csh.rit.edu:443  -CApath /usr/lib/ssl/certs -CAfile ./CSH-CA-cert.crt | openssl x509 -text
depth=1 /O=Computer Science House/OU=OPComm/emailAddress=sysadmin@csh.rit.edu/L=Rochester/ST=New York/C=US/CN=OPComm
verify return:1
depth=0 /C=US/ST=New York/O=Computer Science House/OU=OPComm/CN=*.csh.rit.edu
verify return:1
Certificate:
    Data:
        Version: 1 (0x0)
        Serial Number: 152 (0x98)
        Signature Algorithm: sha1WithRSAEncryption
        Issuer: O=Computer Science House, OU=OPComm/emailAddress=sysadmin@csh.rit.edu, L=Rochester, ST=New York, C=US, CN=OPComm
        Validity
            Not Before: Oct  7 03:43:21 2010 GMT
            Not After : Oct  7 03:43:21 2011 GMT
[...]

Here we can see that this certificate is valid from October 7th 2010 until the same date in 2011.

A certificate has both an expiration date and an not-valid-before date. Most often, when clients are reporting that the certificate is no longer valid, it is because the certificate has expired. However, you should never discount the possibility that the client has their system date set far enough in the past such that the certificate isn't valid yet (this has happened to a friend of mine twice in the past month):

adamf@kid-charlemagne:~$ date
Mon Dec  1 10:00:00 EST 2008
adamf@kid-charlemagne:~$ openssl s_client -connect www.google.com:443  -CApath /usr/lib/ssl/certs
CONNECTED(00000003)
depth=2 /C=US/O=VeriSign, Inc./OU=Class 3 Public Primary Certification Authority
verify return:1
depth=1 /C=ZA/O=Thawte Consulting (Pty) Ltd./CN=Thawte SGC CA
verify return:1
depth=0 /C=US/ST=California/L=Mountain View/O=Google Inc/CN=www.google.com
verify error:num=9:certificate is not yet valid
notBefore=Dec 18 00:00:00 2009 GMT
[...]
    Verify return code: 9 (certificate is not yet valid)

It is a good idea to renew your certificate a month or so before it expires, but only install it a day or two before the current cert expires. This will help make sure clients whose system clocks are skewed to the past a few minutes or hours don't see a certificate error.

If you have a local copy of a certificate in PEM format you can also cat that file to openssl to see the details of the certificate:

adamf@kid-charlemagne:~$ cat CSH-CA-cert.crt  | openssl x509 -text
Certificate:
    Data:
        Version: 3 (0x2)
        Serial Number:
            a5:0f:04:db:62:85:0b:83
        Signature Algorithm: md5WithRSAEncryption
[...]

You can use these commands to setup a monitor that checks your certificates and warns when the certificates are a few weeks from expiring.

More One Liners

Use OpenSSL to Base64 encode/decode a file (add -in and you can specify a filename instead of stdin):

adamf@kid-charlemagne:~$ echo foo | openssl enc -base64
Zm9vCg==
adamf@kid-charlemagne:~$ echo foo | openssl enc -base64 | openssl enc -d -base64
foo

Use OpenSSL to encrypt a file:

adamf@kid-charlemagne:~$ openssl enc -aes-256-cbc -salt -in secret.txt -out secret.enc
enter aes-256-cbc encryption password:
Verifying - enter aes-256-cbc encryption password:
adamf@kid-charlemagne:~$ cat secret.enc 
?)B??Y*?U_??F?<S?/;?,?m?T1?дTGtzadamf@kid-charlemagne:~$

And decrypt:

adamf@kid-charlemagne:~$ openssl enc -d -aes-256-cbc -salt -in  secret.enc
enter aes-256-cbc decryption password:
The secret password is pencil

Use OpenSSL as an SSL-protected HTTP-based file browser:

adamf@kid-charlemagne:~/testwww$ echo "This is a file served by openssl" > foo
adamf@kid-charlemagne:~/testwww$ openssl s_server -cert ../ssl-cert-snakeoil.pem -key ../ssl-cert-snakeoil.key -WWW
Using default temp DH parameters
Using default temp ECDH parameters
ACCEPT

And test it out:

adamf@kid-charlemagne:~$ openssl s_client -connect localhost:4433
CONNECTED(00000003)
depth=0 /CN=kid-charlemagne
[...]

GET /foo HTTP 1.1
HTTP/1.0 200 ok
Content-type: text/plain

This is a file served by openssl
read:errno=0

Conclusion

Debugging SSL problems can be tricky, and I hope you've found this exploration into debugging with openssl useful. Feedback on this article is very welcome, so please feel free to comment here or hit me up on twitter.

Other Resources

The OpenSSL home page.

There's a great list of one-liners and other useful tricks you can do with on The OpenSSL Command-Line HOWTO.

Setting up Apache with SSL has many guides on the Internet; I'd suggest you Google to find out what your distribution recommends. For Ubuntu, this document covers the bases.

O'Reilly has a good tutorial on configuring Apache with SSL without use a specific distribution.

And finally, Apache's SSL documentation.

December 2, 2010

Day 2 - Going Parallel

This article was written by Brandon Burton, aka @solarce.

As system administrators, we are often faced with tasks that need to run against a number of things, perhaps files, users, servers, etc. In most cases, we resort of a loop of some sort, often, just a for loop in the shell. The drawback to this seemingly obvious approach, is that we are constrained by the fact that this approach is serial and so the time it will take increases linearly with the number of things we are running the task against.

I am here to tell you there is a better way, it is the path of going parallel!

Tools for your shell scripts

The first place to start is with tools that can replace that for loop you usually use and add some parallelism to the task you are running.

The two most well known tools that are available are:

  1. xargs
  2. gnu parallel

xargs is a tool used to build and execute command lines from standard input, but one of its great features is that it can execute those command lines in parallel via its -P argument. A quick example of this is:

seq 10 20 | xargs -n 1 -P 5 sleep

This will send a sequence of numbers to xargs and divide it into chunks of one argument (-n 1) at a time and fork off 5 parallel processes (-P 5) to execute each. You can see it in action:

$ ps -eaf | grep sleep
baron     5830  5482  0 11:12 pts/2    00:00:00 xargs -n 1 -P 5 sleep
baron     5831  5830  0 11:12 pts/2    00:00:00 sleep 10
baron     5832  5830  0 11:12 pts/2    00:00:00 sleep 11
baron     5833  5830  0 11:12 pts/2    00:00:00 sleep 12
baron     5834  5830  0 11:12 pts/2    00:00:00 sleep 13
baron     5835  5830  0 11:12 pts/2    00:00:00 sleep 14

Some further reading on xargs is available at:

gnu parallel is a lesser known tool, but has been gaining popularity recently. It is written with the specific focus on executing processes in parallel. From the home page description: "GNU parallel is a shell tool for executing jobs in parallel locally or using remote machines. A job is typically a single command or a small script that has to be run for each of the lines in the input. The typical input is a list of files, a list of hosts, a list of users, a list of URLs, or a list of tables."

A quick example of using parallel is:

% cat offlineimap-cron5min.plist | parallel --max-procs=8 --group 'echo "Thing: {}"'
Thing:       <string>offlineimap-cron5min</string> 
Thing:     <key>Label</key> 
Thing:       <string>solarce</string> 
Thing:     <key>UserName</key> 
Thing:   <dict> 
Thing:     <key>ProgramArguments</key> 
Thing:       <string>admin</string> 
...

This plist file is xml, but the output of parallel is unordered above because each line of input is processed by one of the 8 workers and output occurs (--group) as each worker finishes an input (line) and not necessarily in the order of input.

Some further reading on parallel is available at:

Additionally, there is a great screencast on it.

Tools for multiple machines

The next step in our journey is to progress from just running parallel processes to running our tasks in parallel on multiple machines.

A common approach to this is to use something like the following:

for server in $(cat list_of_servers.txt); do
    ssh $server command argument
done

While this approach is fine for small tasks on a small number of machines, the drawback to it is that it is executed linearly, so the total time the job will take is as long as the task takes to finish multiplied by the number of machines you are executing it on, which means it could take a while, so you'd better get a Snickers.

Fortunately, people have recognized this problem and have developed a number of tools have been developed to solve this, by running your SSH commends in parallel.

These include:

I'll illustrate how these work with a few examples.

First, here is a basic example of pssh (on Ubuntu the package is 'pssh,' but the command is 'parallel-ssh'):

# cat hosts-file
p1
p2

# pssh -h hosts-file -l ben date
[1] 21:12:55 [SUCCESS] p2 22
[2] 21:12:55 [SUCCESS] p1 22

# pssh -h hosts-file -l ben -P date
p2: Thu Oct 16 21:14:02 EST 2008
p2: [1] 21:13:00 [SUCCESS] p2 22
p1: Thu Sep 25 15:44:36 EST 2008
p1: [2] 21:13:00 [SUCCESS] p1 22

Second, here is an example of using sshpt:

./sshpt -f ../testhosts.txt "echo foo" "echo bar"
Username: myuser
Password:
"devhost","SUCCESS","2009-02-20 16:20:10.997818","0: echo foo
1: echo bar","0: foo
1: bar"
"prodhost","SUCCESS","2009-02-20 16:20:11.990142","0: echo foo
1: echo bar","0: foo
1: bar"

As you can see, these tools simplify and parallelize your SSH commands, decreasing the execution time that your tasks take and improving your efficiency.

Some further reading on this includes:

Smarter tools for multiple machines

Once you've adopted the mindset your tasks can be done in parallel and you've started using one of the parallel ssh tools for executing ad-hoc commands in a parallel fashion, you may find yourself thinking that you'd like to be able to execute tasks in parallel, but in a more repeatable, extensible, and organized fashion.

If you were thinking this, you are in a luck. There is a class of tools commonly classified as Command and Control or Orchestration tools. These tools include:

These tools are built to be frameworks within which you can build repeatable systems automation. Mcollective and capistrano are written in Ruby, and Func and Fabric are written in Python. This gives you options for whichever language you prefer. Each has strengths and weaknesses. I'm a big fan of Mcollective in particular, because it has the strength of being built on Puppet and its primary author, R.I. Pienaar has a vision for it to become an extremely versatile tool for the kinds of needs that fall within the realm of Command and Control or Orchestration.

As it's always easiest to grasp a tool by seeing it in action, here are basic examples of using each tool:

mcollective

% mc-package install zsh

 * [ ============================================================> ] 3 / 3

web2.my.net                      version = zsh-4.2.6-3.el5
web3.my.net                      version = zsh-4.2.6-3.el5
web1.my.net                      version = zsh-4.2.6-3.el5

---- package agent summary ----
           Nodes: 3 / 3
        Versions: 3 * 4.2.6-3.el5
    Elapsed Time: 16.33 s

func

% func client15.example.com call hardware info
{'client15.example.com': {'bogomips': '7187.63',
                          'cpuModel': 'Intel(R) Pentium(R) 4 CPU 3.60GHz',
                          'cpuSpeed': '3590',
                          'cpuVendor': 'GenuineIntel',
                          'defaultRunlevel': '3',
...
                          'systemSwap': '8191',
                          'systemVendor': 'Dell Inc.'}}

fabric

% fab -H localhost,linuxbox host_type
[localhost] run: uname -s
[localhost] out: Darwin
[linuxbox] run: uname -s
[linuxbox] out: Linux

Done.
Disconnecting from localhost... done.
Disconnecting from linuxbox... done.

capistrano

# cap invoke COMMAND="yum -y install zsh"
  * executing `invoke'
  * executing "yum -y install zsh"
    servers: ["web1", "web2", "web3"]
    [web2] executing command
    [web1] executing command
    [web3] executing command
    [out :: web3] Nothing to do
    [out :: web2] Nothing to do
    [out :: web1] Complete!
    command finished

As you can see from these brief examples, each of these tools accomplishes similar things, each one has a unique ecosystem, plugins available, and strengths and weaknesses, a description of which, is beyond the scope of this post.

Taking your own script(s) multithreaded

The kernel of this article was an article I recently wrote for my employer's blog, Taking your script multithreaded, in which I detailed how I wrote a Python script to make an rsync job multithreaded and cut the execution time of a task from approximately 6 hours, down to 45 minutes.

I've created a git repo out of the script, so you can take my code and poke at it. If you end up using the script and make improvements, feel free to send me patches!

With the help of David Grieser, there is also a Ruby port of the script up on Github.

These are two good examples of how you can easily implement a multithreaded version of your own scripts to help parallelize your tasks.

Conclusion

There are clearly many steps you can take along the path to going parallel. I've tried to highlight how you can begin with using tools to execute commands in a more parallel fashion, progress to tools which help you execute ad-hoc and then repeatable tasks across many hosts, and finally, given some examples on how to make your own scripts more parallel.

December 1, 2010

Day 1 - Linux Containers (LXC)

This article was written by Ken Barber (http://bob.sh/).

Introduction

Linux Containers (abbreviated as LXC) provide a kind of virtual machine that operates within an operating system. For clarity and to keep the semantical pedants happy, this kind of virtualisation is often dubbed "Operating system-level virtualisation." This provides an alternative (or arguably a subset) to what is known as "platform virtualisation" solutions such as KVM, Xen or Vmware.

In the past, we have often used chroot jails to achieve this kind of effect, and products like LXC are simply a modern evolution of this old idea by including isolation and resource management through extensions to the kernel.

This is by no means a new idea. Other examples of technologies like this already include:

  • Solaris Zones
  • BSD Jails
  • OpenVZ
  • Linux vserver
  • FreeVPS

What makes LXC the topic of discussion, here, is that its development has recently made it into the Linux kernel as an official mechanism for providing containers. While these features are always improving, LXC is reaching a stage where it can be considered for production (depending on your level of conservatism, of course), and I feel that it deserves some well earned attention.

Platform vs. OS-level virtualisation

LXC, as mentioned, provides operating system-level virtualisation. For better or worse this means programs still run in the main OS, so only one kernel is ever in operation. This may be an advantage or a disadvantage depending on what you are trying to achieve. Having said that, it provides a level of isolation that is similar to other virtualisation techniques.

For example, if you wish to run a large number of Apache instances while ensuring they are isolated from each other, then LXC is a good fit. Doing this same job using platform virtualisation can add resource overhead thereby not providing the same level of scalability.

I often found that using full virtualisation was wasteful in cases where the instance was created for isolation purposes (which can be handy) but the usage itself was very low. Small mysql databases often need isolation due to differing cache and tuning requirements (and my desire to not have an application kill a shared database platform) but having extra copies of net-snmp and ssh and other system and support tools was wasteful.

On the other hand, if you want to provide complete environments to different groups or customers including SSH, specific OS distributions and kernel revisions then platform virtualisation might be a better fit.

Its all about common sense and finding the right fit. Sometimes the best fit is often a hybrid one. The good news is that libvirt supports LXC now, which means provisioning LXC and KVM (for example) can be managed with the same tool. Also, you can run LXC containers inside a platform virtualised environment. This means you can have LXC containers inside KVM for example, allowing you to create quite interesting mixes of the technologies.

The Technology

LXC works to provide instance isolation and resource control by using several techniques:

  • chroot
  • namespace
  • cgroups

A chroot is an old technique for providing application security through file access isolation. It provides a way to "re-root" a program so that it is not able to access files above that directory. For example if you chroot'd an application to /srv/foo, the application would see / (which is really /srv/foo on the host) only and not be able to access /srv/bar.

The namespace feature was developed as part of LXC. It allows you to isolate resources from each other. These resources can be process IDs, networking information (routes, iptables, interfaces etc.), ipc, and mounts. Much like a chroot works for files, namespace control allows you to isolate process lists so container A cannot see container B's processes.

cgroups was also developed as part of LXC. It allows you to logically bundle together resources and apply resource management, accounting, isolation and other policies to them. This feature provides you with proper control of your container, not just by hiding information but by providing constraints around it.

Together, the complete effect is that a virtual environment created with LXC can be created that in effect looks like a real machine (or perhaps a full virtual machine) but really the processes and functions within it run within the host os's kernel.

Installation

This installation guide here is based around Ubuntu or Debian. A lot of the concepts are the same however on other distributions, and the user space tools for LXC should be roughly identical.

To begin with, we'll need some tools. You will need to install the following packages:

apt-get install lxc bridge-utils debootstrap

Now, for networking its best to place your primary interface inside a bridge. You can achieve this by modifying /etc/network/interfaces as such:

# The primary network interface
#allow-hotplug eth0
#iface eth0 inet dhcp

auto br0
iface br0 inet dhcp
       bridge_ports eth0
       bridge_fd 0
       bridge_maxwait 0

To configure cgroups, you need a special mount (its much like the proc or sys filesystem). Create a new entry in /etc/fstab like so:

cgroup          /cgroup         cgroup  defaults        0       0

Then create the /cgroup directory and mount it.

mkdir -p /cgroup
mount /cgroup

The /cgroup mount can be poked by hand (like /proc) to adjust various resource settings. Later we'll talk about how resource management can be controlled using lxc user space tools.

Manipulating Containers

Once you have done the preliminary steps, you can now start creating and working with containers. Try creating a container named 'vm0' by typing the following commands:

mkdir -p /var/lib/lxc/vm0
/usr/lib/lxc/templates/lxc-debian -p /var/lib/lxc/vm0/

The command lxc-debian is in fact one of a few a wrapper scripts that simplifies the container creation process. It performs a number of tasks for you:

  • Downloads a minimal debian root using 'debootstrap' from http://ftp.debian.org/ to /var/lib/lxc/vm0/rootfs
  • Configures inittab, hostname, locale and networking for the container
  • Removes any unnecessary services such as hwclock and umountfs
  • Sets the root password to 'root'
  • Creates a configuration file in /var/lib/lxc/vm0/config

Of course you are always free to create your own script or to modify this one. In most cases if you are looking to provision lots of containers that perform similar functions its recommended that you tailor your own template to your needs.

There are a number of lxc command line tools for manipulating containers. Most of these are fairly self-explanatory by looking at their name. Lets start by getting a list of instances:

# lxc-ls

Then getting state information on the instance you just created:

# lxc-info --name vm0

Once prepared, you can start the container in the background with:

# lxc-start -d --name vm0

Then connect to the console of your container using:

# lxc-console --name vm0

At this point you will be prompted with a Linux console login prompt. Log into the console using root/root and take a look around. You will notice that a 'ps auxw' results in only a small number of processes. Try the same in your main OS, and you will see that you can see these processes as well, however the PIDs are different.

Doing a pstree -pl however, allows you to see the relationship to a container easily enough:

|-lxc-start(22715)---init(22716)---dhclient3(22917)
|                                |---getty(23006)
|                                |---getty(23008)
|                                |---getty(23009)
|                                |---getty(23010)
|                                \---login(23007)---bash(23013)

Notice how the container has its own copy of init? This provides a convenient (and familiar) parent supervisor for all processes running in your container. Modifying the containers /etc/inittab works just like the real thing, too.

To view container processes clearly from your real OS use this command:

# lxc-ps --name vm0

Or, to see the processes for all containers (including a column which tells you which container they are in) try:

# lxc-ps --lxc

Now to exit out of your console, type Ctrl-A then q. You can then shutdown your instance with:

# lxc-stop --name vm0

Finally - if you wish to destroy your vm, simply do this with:

# lxc-destroy --name vm0

This will delete the rootfs and configuration permanently.

Resource Management

Resource management is taken care of by the cgroups kernel feature.

CPU resource allocation can be done a number of ways, by either pinning CPU affinity or by providing shares. For example, to control CPU affinity for our process, you can use the lxc-cgroup command. First of all lets find out what the current setting is:

# lxc-cgroup -n vm0 cpuset.cpus
0-1

This means that vm0 can use CPU 0 or 1. You can adjust this by providing a new value:

# lxc-cgroup -n vm0 cpuset.cpus '0'

Now our container processes will only schedule on CPU 0. The alternative is to adjust shares, thereby defining priority of instances:

# lxc-cgroup -n vm0 cpu.shares '2048'

# lxc-crgoup -n vm1 cpu.shares '1024'

The above command signifies that vm0 will get twice as much priority as vm1.

If you are looking to permanent change these settings for a specific container, modify the containers configuration file: /var/lib/lxc/vm0/config (for container 'vm0')

For example, to add a specific cpu affinity and share to the container add the line:

lxc.cgroup.cpuset.cpus = 0
lxc.cgroup.cpuset.shares = 2048

There are lots of settings regarding resource management. Its recommended to read the cpuset.txt documentation (see references) for futher details.

Other Cool Stuff

For those cases where you want to pause a container, freezing and unfreezing instances can be done simply with:

# lxc-freeze --name vm0
# lxc-unfreeze --name vm0

If you want the power of LXC but don't want the hassle of creating an environment first a temporary container for running a job can be created simply with:

# lxc-execute -n temp1 -- 'top'

This container can benefit from cgroups management and namespace isolation just like a real container so may come in handy for wrapping application executions.

For fun, I recommend trying some of the other templates available in /var/lib/ lxc/templates. If you install the package 'febootstrap' you can try out lxc-fedora which installs a mini Fedora root for you to use inside Debian and Ubuntu.

Conclusion

I have only touched upon a number of functions within this LXC introduction, so I recommend researching further if you wish to implement this in the wild.

In the mass-hysteria that is the 'Cloud' it's easy to forget that the solution is all about the problem, not the other way around. There is no doubt that at times containers and LXC will provide a neat alternative to platform virtualisation but sometimes this will be the other way around. This of course as usual depends on the problem at hand.

As you can see, LXC is pretty straight-forward. Be sure to try alternative container tools I listed as well, as LXC may not suite your needs (or taste) exactly. Lasty, anything new and adventurous should be thoroughly tested before production deployment to avoid late night adventures.

Further reading: