Showing posts with label monitoring. Show all posts

December 18, 2021

Day 18 - Minimizing False Positive Monitoring Alerts with Checkmk

By: Elias Voelker (@Elijah2807) and Faye Tandog (@fayetandog
Edited by: Jennifer Davis (@sigje)

Good IT monitoring stands and falls with its precision. Monitoring must inform you at the right time when something is wrong. But similar to statistics, you also have to deal with errors produced by your monitoring. In this post, I will talk about two types of errors - false positives and false negatives. And similar again to statistics, you can’t eliminate these errors completely in your monitoring. The best you can do is manage them and optimize for an acceptable level of errors.

In this article, I share ways in which you can fine-tune notifications from your monitoring system, to alleviate noisy alerts and ideally receive only those alerts that are really relevant.

Fine-tuning notifications is one of the most important and rewarding activities when it comes to configuring your monitoring system. The impact of a well-defined notification setup is felt immediately. First and foremost, your team will benefit from better focus due to less ‘noise’. This ultimately results in better service levels and higher service level objective (SLO) attainment across the board.

In this article, I talk about ‘alerts’ and ‘notifications’ using them interchangeably. An ‘alert’ or ‘notification’ is your monitoring system letting you know that something is supposedly wrong. Depending on your setup, this may be via email, text or a trouble ticket in PagerDuty.

When I talk about a ‘monitoring system’, I’m referring to both ‘traditional’ IT infrastructure and application monitoring tools such as Nagios, Zabbix, or Solarwinds Orion, as well as cloud-based monitoring solutions such as Prometheus, Datadog or Sensu.

Types of Alert Errors

Let’s start by examining two common alert errors: false positives and false negatives.

A false positive would be your monitoring tool alerting about an issue when in reality the monitored system is perfectly fine (or has recovered in the meantime). It could be a server or service being shown as DOWN because there was a short glitch in the network connection, or a specific service instance, for example Apache restarting to rotate its logs.

False negatives are when your monitoring system does not alert you, although something really is wrong. If you're running an on-prem infrastructure and your firewall is down, you want to know about it. If your monitoring system for some reason does not alert you about this, your network may be exposed to all kinds of threats, which can get into real trouble, really quickly.

However, the cost of erroneous alerting can differ vastly. Hence, when IT Ops teams try to determine the acceptable level of false positives versus an acceptable level of false negatives, they will often deem false positives more acceptable. Because a false negative could be a mission critical system down and not alerting. A false positive might just be one unnecessary notification that’s quickly deleted from your inbox.

This is why they will err on the side of caution and notify, which is totally understandable. The consequence, however, is that these teams get drowned in meaningless alerts, which increases the risk of overlooking a critical one.

Because notifications will only be of help when no — or only occasional — false alarms are produced.

In this article, I use Checkmk to show examples of minimizing false positive alerting. You can apply the same philosophy with other tools though they may vary in implementation and functionality.

1. Don’t alert.

My first tip to improve monitoring and reduce the noise of false notifications is to simply not send notifications. Seriously!

In Checkmk, notifications are actually optional. The monitoring system can still be used efficiently without them. Some large organizations have a sort of control panel in which an ops team is constantly monitoring the Checkmk interface. As they will be visually alerted, additional notifications are unnecessary.

These are typically users that can’t risk any downtime of their IT at all, like a stock exchange for example. They use the problem dashboards in Checkmk to immediately see the issue and its detail. As the lists are mostly empty, it is pretty clear when something red pops up on a big dashboard.

But in my opinion, this is rather the exception. Most people use some way of notifying their ops and sysadmin teams, be it through email, SMS or notification plugins for ITSM tools such as ServiceNow, PagerDuty or Splunk OnCall.

2. Give it time

So if you’ve decided you don’t want to go down the ‘no notifications’ route from my previous point, you need to make sure that your notifications are finely tuned to only notify people in case of real problems.

The first thing to tell your monitoring is: Give the system being monitored time.

Some systems produce sporadic and short-lived errors. Of course, what you really should do is investigate and eliminate the reason for these sporadic problems, but you may not have the capacity to chase after all of them.

You can reduce alarms from systems like that in two ways:

  • You can simply delay notifications to be sent only after a specified time AND if the system state hasn’t changed back to OK in the meantime.
  • You can alert on the number of failed checks. For Checkmk this is the ‘Maximum number of check attempts for service’ rule set. This will make the monitoring system check for a defined number of times before triggering a notification. By multiplying the number of check attempts with your defined check interval you can determine how much time you want to give the system. The default Checkmk interval is 1 minute, but you can configure this differently.

The two options are slightly different in how they treat the monitored system. By using the number of failed checks, you can be sure that the system has really been re-checked. If you alert only based on time and you (or someone else) changed the check interval to a longer timeframe you gain nothing. In Checkmk specifically there are some other factors as well, but that’s out of scope for this article. The essential effect is: By giving a system a bit of time to ‘recover’, you can avoid a bunch of unnecessary notifications.

This method also works great for ‘self-healing’ systems that should recover on their own; for example, you wouldn’t want to get a notification for a cloud provider killing an instance to upgrade it when your code will automatically deploy a new container instance to handle requests

Of course, this is not an option for systems that are mission-critical with zero downtime that require rapid remediation. For example, a hedge-fund that monitors the network link to a derivative marketplace can't trade if it goes down. Every second of downtime costs them dearly.

3. On average, you don’t have a problem

Notifications are often triggered by threshold values on utilization metrics (e.g. CPU utilization) which might only exceed the threshold for a short time. As a general rule, such brief peaks are not a problem and should not immediately cause the monitoring system to start notifying people.

For this reason, many check plug-ins have the configuration option that their metrics are averaged over a longer period (say, 15 minutes) before the thresholds for alerting are applied. By using this option, temporary peaks are ignored, and the metric will first be averaged over the defined time period and only afterwards will the threshold values be applied to this average value.

4. Like parents, like children

Imagine the following scenario: You are monitoring a remote data center. You have hundreds of servers in that data center working well and being monitored by your monitoring system. However, the connection to those servers goes through the DC’s core switch (forget redundancy for a moment). Now that core switch goes down, and all hell breaks loose. All of the sudden, hundreds of hosts are no longer being reached by your monitoring system and are being shown as DOWN. Hundreds of DOWN hosts mean a wave of hundreds of notifications…

But in reality, all those servers are (probably) doing just fine. Anyway we couldn’t tell, because we can’t connect to them because of the core switch acting up. So what do you do about it?

Configure your monitoring system so that it knows this interdependency. So the server checks are dependent on that core switch. You can do so in Checkmk by using ‘parent-child-relationships’. By declaring host A the ‘Child’ of another ‘Parent’ host B, you tell your Checkmk system that A is dependent on host B. Checkmk pauses notifications for the children if the parent is down.

5. Avoid alerts on systems that are supposed to be down

There are hundreds of reasons why a system should be down at times. Maybe some systems need to be rebooted regularly, maybe you are doing some maintenance or simply don’t need a system at certain times. What you don’t want is your monitoring system going into panic mode during these times, alerting who-knows-whom if a system is supposed to be down. To do that, you can use ‘Scheduled Downtimes’.

Scheduled downtimes work for entire hosts, but also for individual services. But why would you send certain services into scheduled downtimes? More or less for the same reason as hosts – when you know something will be going on that would trigger an unnecessary notification. You still might want your monitoring to keep an eye on the host as a whole, but you are expecting and accepting that some services might go haywire and breach thresholds for some time. An example could be a nightly cron job that syncs data to long term storage, causing the disk I/O check to spike. But, if everything goes back to normal once the sync is through, no need to lose sleep over it.

Moreover, you can extend scheduled downtimes to ‘Children’ of a ‘Parent’ host as well.

Wrapping Up

I hope this short overview has given you some ideas about really simple ways with which you can cut down on the number of meaningless notifications your team is getting from your monitoring system. There are other strategies to do this, but this should get you started.

Additional Resources

If you want to learn more about how to manage notifications in Checkmk, check out this docs article or post a question in the forum.

December 12, 2017

Day 12 - Monitoring Postgres Replication Lag

By: Kathryn Exline (@kathryn_ex)
Edited By: Baron Schwartz (@xaprb)

Have you created replicas of your PostgreSQL databases? I am going to assume you are a good database steward and answered that question with a resounding “YES INDEEDLY DO!” Ned Flanders style. If not, I recommend taking the time to be kind to your future self and do so as soon as possible. We won’t talk about how to do that here, but you can find details on how to configure replication in the PostgreSQL documentation, the PostgreSQL wiki, and around the internet.

With your trusty replicas in place, make sure you take the time to properly monitor your clusters. One of the most important metrics of replication health, albeit seductively easy to over value, is “replication lag”. Before I show you a few simple queries to collect this value on your PostgreSQL clusters, let us briefly talk about replication in PostgreSQL. If you are already familiar with the concept of replication and how it is implemented in PostgreSQL, feel free to skip ahead to the “Why Care About Lag?” section.

The Basics: Replication and WAL

Replication is a mechanism where data from one database (a “primary”) is copied to another secondary database (a “replica” or “standby”), keeping it in sync. Most databases have built-in mechanisms to support this feature. After you configure your primary PostgreSQL database for your service, you should create one or more replica databases in case you lose your primary database or decide you want to offload some operations from the primary. Generally, you initialize a replica with a snapshot of the primary and then it stays up to date by fetching and replaying the primary’s transactions.

PostgreSQL implements replication via the Write-Ahead-Log or the “WAL” (pronounced “wall”, like the big icy thing in Game of Thrones). The notion of the WAL is not unique to PostgreSQL, and is similar to that of journaling in file systems. It ensures transactions are logged durably before they are committed, so updates can be recovered and replayed in the case of a crash. Aside from crash recovery, PostgreSQL leverages the WAL for internal performance gains and built-in replication support.

The WAL is a collection of 16MB binary files located in the pg_xlog directory of your data directory. Each time the database gets a transaction that requires changing any data, it appends a record of the transaction to the most recently created WAL segment file and assigns the record with a Log Sequence Number (LSN) to note its position in the WAL. I explicitly say position and not time because as the term Log Sequence Number suggests, the WAL files and their individual records are based on a sequence-based timeline. Why? Because if you are processing a high volume of transactions, timestamps may not be unique or granular enough to validate that your transactions are executed in the correct serial order. Not to mention time is full of nasty tricksies. This will be important later when we look at the queries you can use to find your primary’s and replicas’ position in the WAL.

PostgreSQL uses the WAL to make replicas of the primary in one of two ways. The latest and greatest is via streaming replication, where each WAL log record is sent to the replica as quickly as possible to be replayed. By default, this is done asynchronously so the replica can process the record without delaying the commit on the primary; however, PostgreSQL also supports synchronous replication where a transaction on the primary must wait until the WAL record is committed on both the primary and and the replica before considering the transaction successful.

The second and older option is via log-shipping where it ships one full WAL segment file (16MB) at a time from the primary to a replica. This generally results in higher replication lag since the replica will not receive the WAL records until the file is completely filled. Streaming replication is best for most use cases, but I recommend reading the PostgreSQL documentation around log-shipping standby servers for in-depth explanations of these two options.

Why Care About Lag?

Replication lag is the replica’s distance behind the primary in the sequential timeline. The time it takes to copy data from the primary to a replica, and apply the changes, can vary based on a number of factors including network time, replication configuration, and activity on both the primary and replicas. Unsurprisingly, I have seen replication lag spike on several occasions due to network issues. In another case, I saw replication lag spike on a replica that was not able to find and recover a WAL file from an archiving node, and it quietly fell out of date. The potential causes are widespread and I have found that replication lag is often an indicator that something is subtly failing or behaving unexpectedly.

Ultimately, it is safe to assume that there will be some amount of lag on any replica. But why do you need to know the replication lag in your clusters?

Disaster Recovery

In most scenarios where a primary database is lost, users want to promote the most up to date replica to ensure minimal data loss. You and your tooling can measure the lag to select the optimal replacement for the primary.

Service Strategies and Optimizations

If you connect all of your clients to the primary, you will eventually overload your database. When this happens, a common technique is to direct some read-only queries to replicas; however, If you don’t build your service to be aware of, and tolerate, replication lag, then your users will experience inconsistent behavior from your service. Knowing the typical replication lag of your replicas will help you strategize which services can still function in spite of potential lag.

Debugging and Observation

Just as measuring latency in an HTTP request can indicate an underlying issue, unusually high replication lag can indicate an issue with your databases. Unfortunately replication lag in isolation rarely informs users of the specific underlying problem, but it is a broad indicator of several issues and is another data point in your observability toolbelt.

How To Monitor Lag: Get Your “See Lags”

Now that we have a handle on the importance of monitoring your replication lag, let’s dive into two ways to measure replication lag.

By WAL Location

The most accurate way to determine the lag is to compare the current WAL location on the primary with the last WAL location received by the standby. To find the LSN value of the current WAL location in Postgres versions older than 10.x, run the following on the primary:

=# select pg_current_xlog_location();

In Postgres 10.x, you’ll need to use a newer function:

=# select pg_current_wal_lsn();

You should get an LSN value which looks like the following:

 pg_current_xlog_location 
--------------------------
 9C/1E306050
(1 row)

To find the LSN value of the last WAL location received and synced to disk by the standby, run the following on the replica. Once again, there’s a pre-10 syntax and a newer version for Postgres 10.x:

=# -- in Postgres 9.x
=# select pg_last_xlog_receive_location();

=# -- in Postgres 10.x
=# select pg_last_wal_receive_lsn();

You should get a similar record as the previous function:

 pg_current_xlog_location 
--------------------------
 95/75619450
(1 row)

Note that these functions denote what WAL position the replica has received from the primary, but not what it has applied to bring the replica’s copy into sync with the primary. There could be a difference between these two values. To find out what the replica has replayed, use the following functions on the replica:

=# -- in Postgres 9.x
=# select pg_last_xlog_replay_location();

=# -- in Postgres 10.x
=# select pg_last_wal_replay_lsn();

You can determine whether the replica is at the same point in the WAL as the primary by comparing the values of what’s been committed on the primary and what’s been received or replayed on the replica. The disadvantage of using WAL position is that, despite being an accurate representation of lag, it is difficult for humans to understand what an LSN difference really means. I have seen clever scripts that convert LSN’s to the byte position in the WAL and take the difference of these values, but there is an easier option that leverages another built-in function to approximate time lag.

By Time Difference

I told you earlier that time was tricky and the WAL is based on a sequence, but timestamps are more readable to humans and ingestible by external tools than the WAL location values. PostgreSQL can extract the timestamp of a given WAL location, allowing you to compare the timestamp of the last played transaction in the WAL with the current time using the following query on your replica:

=# -- Same in both Postgres 9.x and 10.x 
=# select now() - pg_last_xact_replay_timestamp();

This value needs to be read with additional context and taken with a grain of salt. It is meant to be an approximation of lag and should be treated as such. I find this query most useful to inject into my time-series observability metrics or to toss in a terminal pane when running operations that might affect lag. If you are selecting a replica to replace a failed primary, you should use the LSN instead of the approximate timestamp of the LSN.

Other Helpful Queries and Tools

You can run the following to determine whether you are interacting with the primary or a replica. A replica will return ‘t’ and the primary will return ‘f’:

=# select pg_is_in_recovery();

You can also translate the LSN value returned by the functions mentioned above to the name of the WAL file name within your pg_xlog directory using:

=# -- In Postgres 9.x
=# select pg_xlogfile_name(pg_last_xlog_receive_location());

=# -- In Postgres 10.x
=# select pg_walfile_name(pg_last_wal_receive_lsn());

If you are curious about what a WAL file actually looks like, PostgreSQL introduced the pg_xlogdump tool in version 9.3 to convert the contents of the binary WAL file into human readable form. Note this tool was renamed to pg_waldump in version 10.0 and is intended for educational purposes only.

Beyond the Queries

If your databases run on a cloud platform, your provider may already provide these metrics for you. For example, AWS Cloudwatch provides the ReplicaLag metric and GCP provides the replication metric. Finally, whether you use external tooling to monitor your replication lag or write your own monitoring plugins, you need to consider how you actually use these metrics.

As we discussed earlier, replication lag is a helpful metric and provides additional data points when making decisions about your services, but think long and carefully before alerting or paging around replication lag. You probably don’t want to. Replication lag is susceptible to a variety of factors, some of which are not actionable or inherently wrong, and it varies enough that you could find yourself bogged down in tuning alerting thresholds or developing complex anomaly detection. If you do choose to page on this value, make sure you embed plenty of headroom in your thresholds, provide context around potential lag causes in your alerting tools, and give your on-call rotation a few extra high-fives.

ADDITIONAL READING

December 18, 2014

Day 18 - Adding Context to Alerts with nagios-herald

Written by: Ryn Daniels (@rynchantress)
Edited by: Jennifer Davis (@sigje)

3am Pages Suck!

As sysadmins, we all know the pain that comes from getting paged at 3am because some computery thing somewhere has caught on fire. It’s dark, you were having a perfectly pleasant dream about saving the world from killer robots, or cake, or something, when all of a sudden your phone starts making a noise like a car alarm. It’s your good friend Nagios, disturbing your slumber once again with word of a problem and very little else.

We might hate it for being the bearer of bad news, but Nagios is a well-known and time-tested monitoring and alerting tool. It does its job well- it runs the checks we tell it to, when we tell it to, and it dutifully whines when those checks fail. The problem with its whining, however, is that by default there is very little context around it.

Adding Context to 3am

As an example, let’s take a look at everyone’s favorite thing to get woken up by, the disk space check. Disk Space Alert Without Context

We know that the disk space has just crossed the warning threshold. We know the amount and percentage of free space on this volume. We know what volume is having this issue, and what time the notification was sent. But this doesn’t tell us anything more. Was this volume gradually getting close to the threshold and just happened to go over it during the night? If so, we probably don’t care in the middle of the night - a nice slow increase means that it won’t explode during the night and can be fixed in the morning instead. On the other hand, was there a sudden drastic increase in disk usage? That’s another matter entirely, and something that someone probably should get out of bed for.

This kind of additional context provides really valuable information as to how actionable this alert is. And when we get disk space alerts, one of the first things we do is to check how quickly the disk has been filling up. But in the middle of the night, that’s asking an awful lot - getting out of bed to find a laptop, maybe arguing with a VPN, finding the right graphite or ganglia graph - who wants to do all that when what we really want to do is go back to sleep?

With nagios-herald, the computers can do all of that work for us.

Disk Space Alert With Context

Here we have a bunch of the most relevant context added into the alert for us. We start with a visual indicator of the problematic volume and how full it is, so eyes bleary from sleep can easily grok the severity of the situation. Next is a ganglia graph of the volume over the past day, to give an idea of how fast it has been filling up (and if there was a sudden jump, when it happened, which can often help in tracking down the source of a problem). The threshold is there as well, so we can tell if a critical alert is just barely over the threshold or OH HEY THIS IS REALLY SUPER SERIOUSLY CRITICAL GET UP AND PAY ATTENTION TO IT. Finally, we have alert frequency, to know easily if this is a box that frequently cries wolf or one that might require more attention.

Introducing Formatters

All this is done by way of formatters used by nagios-herald. nagios-herald is itself just a Nagios notification script, but these formatters can be used to do the heavy lifting of adding as much context to an alert as can be dreamt up (or at least automated). The Formatter::Base class defines a variety of methods that make up the core of nagios-herald’s formatting. More information on these methods can be found in their documentation, but to name a few: * add_text can be used to add any block of plain text to an alert - this could be used to add information such as which team to contact if this alert fires, whether or not the service is customer-impacting, or anything else that might assist the on-call person who receives the alert. * add_html can add any arbitrary HTML - this could be a link to a run-book with more detailed troubleshooting or resolution information, it could add an image (maybe a graph, or just a funny cat picture), or just turn the alert text different colors for added emphasis. * ack_info can be used to format information about who acknowledged the alert and when, which can be especially useful on larger or distributed teams where other people might be working on an issue (maybe that lets you know that somebody else is so on top of things that you can go back to sleep and wait until morning!)

All of the methods in the formatter base class can be overridden in any subclass that inherits from it, so the only limit is your imagination. For example, we have several checks that look at graphite graphs and alert (or not) based on their value. Those checks use the check_graphite_graph formatter, which overrides the additional_info base formatter method to add the relevant graph to the Nagios alert:

def additional_info
    section = __method__
    output = get_nagios_var("NAGIOS_#{@state_type}OUTPUT")
    add_text(section, "Additional Info:\n #{unescape_text(output)}\n\n") if output
    output_match = output.match(/Current value: (?<current_value>[^,]*), warn threshold: (?<warn_threshold>[^,]*), crit threshold: (?<crit_threshold>[^,]*)/)
    if output_match
      add_html(section, "Current value: <b><font color='red'>#{output_match['current_value']}</font></b>, warn threshold: <b>#{output_match['warn_threshold']}</b>, crit threshold: <b><font color='red'>#{output_match['crit_threshold']}</font></b><br><br>")
    else
      add_html(section, "<b>Additional Info</b>:<br> #{output}<br><br>") if output
    end

    service_check_command = get_nagios_var("NAGIOS_SERVICECHECKCOMMAND")
    url = service_check_command.split(/!/)[-1].gsub(/'/, '')
    graphite_graphs = get_graphite_graphs(url)
    from_match = url.match(/from=(?<from>[^&]*)/)
    if from_match
      add_html(section, "<b>View from '#{from_match['from']}' ago</b><br>")
    else
     add_html(section, "<b>View from the time of the Nagios check</b><br>")
    end
    add_attachment graphite_graphs[0]    # The original graph.
    add_html(section, %Q(<img src="#{graphite_graphs[0]}" alt="graphite_graph" /><br><br>))
    add_html(section, '<b>24-hour View</b><br>')
    add_attachment graphite_graphs[1]    # The 24-hour graph.
    add_html(section, %Q(<img src="#{graphite_graphs[1]}" alt="graphite_graph" /><br><br>))
  end

In this method, it calls other methods from the base formatter class such as add_html or add_attachment to get all the relevant information we wanted to add for these graphite-based checks.

Now What?

If you’re using Nagios and wish its alerts were a little more helpful, go ahead and install nagios-herald and give it a try! From there, you can start customizing your own alerts by writing your own formatters - and we love feedback and pull requests. You’ll have to wrangle some Ruby, but it’s totally worth it for how much more useful your alerts will be. Getting paged in the middle of the night still won’t be particularly fun, but with nagios-herald, at least you can know that the computers are pulling their weight as well. And really, if they’re going to be so demanding and interrupt our sleep, shouldn’t they at least do a little bit of work for us when they do?

December 5, 2014

Day 5 - How To Talk About Monitors, Tests, and Diagnostics

Written by: Yvonne Lam (@yvonnezlam)
Edited by: Jennifer Davis (@sigje)

Over time, I’ve accumulated a short list of statements about test-like things, a personal category that includes monitors and diagnostics as well as traditional tests, that when I hear them make my heart sink into my shoes:

  • “That isn’t a unit/integration/functional test!”
  • “Why do we need a check for that?”
  • “We need to run our functional tests against the production system all the time and alert when they fail.”

These remarks are strong signals that we lack shared context about what we are trying to accomplish with the tests/monitors/diagnostics in question. Ensuing conversation is likely to be difficult unless we can build some.

I think of the context for a test-like thing in terms of five questions:

  1. Where is it going to run?
  2. When is it going to run? (e.g. What events will cause it to run?)
  3. How often will it run?
  4. Who is going to consume the result? (Answers could be “another service”, “an application that generates time-series data”, “a person”, or a chain of any of the above.)
  5. What is that entity or collection of entities going to do with the result?

These questions compose a heuristic, so I don’t feel that all of them need to be answered precisely every time.

For example:

  • A traditional test runs against a non-production system when the system is built or deployed. It will generally run because of an event such as code change or deployment. It will likely run relatively infrequently, e.g. hours rather than minutes or seconds. A person may look at the result of the test with the goal of fixing a bug before it goes into production, or an automated system may look at the aggregate test results in order to decide on the flow of code through a continuous integration or deployment system.
  • A monitor runs against a production or production-like system on a schedule. Most monitors run frequently, as in on minute or sub-minute intervals, although some may trigger based on other events. The result may be consumed directly by an alerting system such as nagios, or by another system to produce time-series or other data. In the first case, a result may cause an alert to fire, resulting in an alarm going off and potentially a person being paged. In the second case, measured changes in the state of the collected data may cause an alert to fire and a person to be notified, or the collected data may be used for other kinds of analysis or presented in other forms. The eventual consumer of the data will be someone who wants to know the state of the running production system.
  • A diagnostic runs against a production or production-like system on demand. It will be run when there is reason to believe that something is wrong. The result will be used to fix the running system, through reconfiguration or code change/deploy. In sufficiently advanced systems, cheap diagnostics may be run all the time, in order to trigger automated healing of common system errors or conditions.

Note that intent matters: checking to see if, say, nginx is available and serving data may be a test, a monitor, or a diagnostic. footnote1

An immediate benefit of this approach is that it allows discussion of test-like things without first wading through a sea of vocabulary. You don’t have to argue about what the difference between an integration test and a functional test is, or struggle for words to explain why converting unit tests to production monitors is probably not going to be the best use of the time you have to spend on monitoring. For the sake of effectiveness, it’s good to converge on shared terms, but if people already have different vocabulary, then that convergence will be eventual, and you may need test-like things before then.

The main reason why I like this approach is that it allows me to be very specific about what the test-like thing under discussion is supposed to do. Being able to say,

  • “This test-like thing writes data to a database. Do we want it to run every time someone makes a code change, given that we need to set up the database before the test and clean it up afterward?” (probably not), or
  • “If we think something is broken, we need to check that data is getting from A to B. Is that something we want to check once every ten seconds when the system is otherwise healthy?” (it depends)
  • “Our functional tests for account setup create new accounts every time. Do we want to create a new account in production every minute?” (probably not if we can alert on failed attempts and/or unusually low counts of new accounts per unit time) footnote2

makes for a more useful conversation, in my opinion.

Specificity is especially useful when people ask for a type of test or monitor that is not consonant with the way the application or service component under examination has been written. For example, a common response to user-facing bugs that depend on system state and hence are not easy to reproduce is, “Write a functional test and run it as a monitoring check.” This is an excellent idea, since it allows one to track how often the problem happens, get closer to understanding what system state is relevant, etc. It also may not be practical. A test that replicates a user scenario is powerful in part because it exercises the entity being tested at a high level of abstraction; attempts to capture that test in code often results in test code that is fragile, requires more access to service or application internals than is readily available, or involves expensive setup and teardown to run at the frequency required. The more specific you can be about what such a monitoring check actually needs to do and what that requires, the better equipped you are to suggest alternatives, or, in the most extreme case, talk about what would need to change in the application in order for it to be monitored as desired.

Gratuitous piece of advice #1: It’s worth considering whether some of those health checks that run all the time could be replaced either with monitors that feed a system for collecting data for trend analysis or with diagnostics that a person could use to probe a running system when they suspect something is wrong. Gratuitous piece of advice #2: It depends on your service, but if it is data-intensive and/or relies heavily on caching to improve performance, using your functional tests as monitors may not get you the result that you want. Services whose primary purpose is data collection and storage are most likely to get use out of functional tests as monitors. For a service that does real-time or near-real-time data mining, I have found that data-dependent functional tests either are or become problematic as monitors.

December 5, 2013

Day 5 - A Gentle Introduction to X-Trace

Written By: TR Jordan (@_tr)
Edited By: Adam Compton (@comptona)

In the world of SaaS applications, good monitoring can be the difference between a successful product and a failure. There's a lot of ink spilled on what to do with your monitoring data, but somewhat less on what that data actually is. Etsy's Measure Everything is a great place to start. Capture points of interest everywhere in your application, and aggregate them up as counters, gauges, and the like. You don't have to stop with series of single numbers, though. Let's talk about gathering structured performance data via X-Trace, starting with a definition:

X-Trace is a network diagnostic tool designed to provide users and network operators with better visibility into increasingly complex Internet applications. It does this by annotating network requests with metadata that can be used to reconstruct requests, even those that make use of multiple network layers. X-Trace "enabled" Internet sites make use of these identifiers to record the path that requests take through their network.

The key bit about X-Trace is right there at the end. X-Trace isn't just a tool to collect metrics; it actually records the path that requests take through your system. This means that the end result isn't just a graph over time of some quantity. It's actually a full view of what happened to that particular request.

The other core feature of X-Trace is something that's left out of the definition. Because X-Trace annotates network calls, it's fundamentally distributed. As it traces requests, those requests aren't limited to a single machine, like a code profiler would be. Each piece of metadata is generated on a separate machine (typically by processes called agents), but a typical implementation also employs a collector which stitches all that information back together into a distributed trace.

The result is that X-Trace data is a much richer data source than something like graphs of machine load, host memory, or the number of signups. It's a full description of how your system responded to a particular request.

Building a Simple Trace

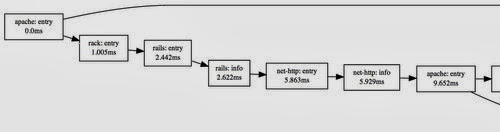
Let's get specific. The underlying data structure X-Trace uses to represent this complex data is a simple Directed Acyclic Graph (DAG). The nodes in the graph are entry and exit events for each layer. Layers are just names for something we want to measure: TCP connection lifetimes, RPCs, or application touchpoints. For a typical web application, it's easy to talk about layers as software packages which use the library in some way, so we'll do that. The first place a request touches a web app is the webserver, so a dirt-simple trace may only have 2 nodes in the graph: Apache Entry and Apache Exit. The edges in this graph point "backwards" -- exit events know about their preceeding entry events. This can be confusing, so let's actually flip them around so the arrows point in causal order. Our simple trace could be drawn (using GraphViz) like this:

Apache serving a static file. It's frequently easier to flip the edges in visualization, even though the underlying data is reversed.

So the forward arrow makes sense--then why did you say the edges point backwards? From an implementation standpoint, they have to! Each node is represented by a metadata string, which is just a bytestring. The high-order bits of this bytestring form the trace ID, a unique identifier which all nodes in this request's trace graph share. The lower-order bits are unique to each node, and typically also randomly generated. These are known as the event ID. Each edge is specified with this event ID. For the trace above, the two events would look like this:

Entry:
  Trace ID: BA84
  Event ID: FEED
  Edges: []
Exit
  Trace ID: BA84
  Event ID: DEEF
  Edges: [FEED]

With only that information, we have everything we need to draw that picture above. As long as we find some way to pass that edge ID between the beginning and the end of the request (and since they're on the same machine, local memory works fine), the events are easy to generate, and the collector can re-create the graph with no problems.

Getting More Complicated

If we were just interested in collecting simple timings, drawing a graph seems like overkill (because it is). The interesting thing about X-Trace is that it scales up to many events in a system, and we can still track them all in one place. Let's add a simple Ruby/Rails server behind Apache. We'll actually put the instrumentation points in basically the same place: at the very beginning of the Ruby request, and right at the end, after it returns the response body.

There's also an "info" event in this one, which can be used to add a bit more color to an entry/exit pair. More on that below!

There's one trick we have to play here to make this work. In Apache, it was easy to pass the event ID around, because it's all the same process. Between Apache and Ruby, they're different processes on different machines. Local memory won't work, so we have to get more creative. Fortunately, X-Trace is flexible; it doesn't matter how the metadata gets between events. In this case, an extra HTTP header (how about "X-Trace"?) on both the request and response works just fine. In general, any extensible protocol with optional parameters works well here: Thrift, Protocol Buffers, or even custom JSON over TCP, if you're rolling your own. If you can find room for a few additional bytes, your protocol can support X-Trace.

Adding these links gives us more than just the two timing measurements in one place; it allows us to start seeing mismatches between components. A frequent problem with multi-tier setups is queueing, particularly between the web server and the application servers. Monitoring just Apache or just Rails doesn't catch it, because the problem is the Apache is sitting around waiting for Rails to listen. There's no wasted work, but there is wasted time. With normal metrics, you have to go looking for it, but with X-Trace, it just shows up as a large time difference between two adjacent nodes.

Real Life Data

From here, we can scale this up to as many protocols and calls as we want. For protocols that don't easily support optional parameters in both directions (SQL, for instance), we can actually measure from the client side. This does have the disadvantage of convolving network latency and on-machine time at the database server, but in most cases, this isn't a big deal.

In these complex cases, this graph structure really starts to shine. A slow request might generate a trace with a slow SQL call. From a single-metrics viewpoint, speeding up this request means making this SQL call faster. With the entire trace, though, the problem might actually manifest as a cache miss immediately before the SQL call, or a strange-looking URL from the webserver because the client was asking for more data than a normal request. This context is crucial to debugging certain classes of problems, and it's simply not available in metrics-based monitoring solutions.

A moderately complex trace ... and it keeps going! This trace has 55 events in total.

Traversing a Trace

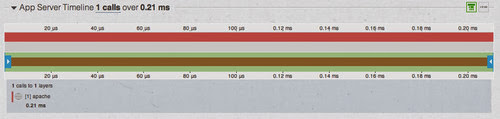
Once traces get big, the trick is to extract useful information out of them. There are a lot of tricks one can use on graphs, but there's actually more structure here we can exploit. Since X-Trace typically starts with entry/exit pairs of events, it's a good idea to build more structure around those pairs. For our simple Apache trace, it's easiest to think about that as a single Apache extent. That means just wrapping up the entry and exit in a single span of time. The (awesomely boring visualization) might look like this:

Just Apache.
Just Apache.

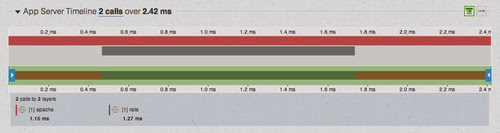
The width is the full timeline of the request: 200us. Now that we have some grounding, we can start to build out more complicated traces below this. Adding rails is just adding a child extent to this top-level extent, and we can represent that with a bar below, on the same timeline:

Deepening the tree.
Deepening the tree.

This looks pretty similar to the events graph, but instead of looking at moments in time, this visualization focuses on layers: the components of the system. It's not as detailed as a profiler at each layer--we're not capturing every function call--but the whole trace is effectively a profiler, ordered by calls, for a distributed system, including access to call structure, self times, and cumulative times.

If you've got a complex architecture, with services calling services, this might look like a bit hairy, but fortunately, many apps scale by adding specialized services, not 50-level-deep calling trees. So you can see a fair bit in one place and, due to the time scale, quickly identify the service that dominated the load time. For instance, that moderately complex trace above reduces down nicely:

In this one, the problem isn't a single layer. Every layer adds a bit of time, meaning that we'll either have to be happy with our 70ms page load time, or look at eliminating an entire service or three.

Using Trace Data

Once we have this structure, sometimes the easiest thing to do with it is go backwards. Because each trace captures a number of different metrics on different layers, we can actually traverse this graph and pull them out into normal-looking graphs. This high-level view is easy to consume, but graphs backed by traces instead of metrics open up another level of drilldown. Spike in memcache latency? It could be because of increased traffic, but looking at a few traces might reveal that it's actually because there are a few URLs that request 10,000 different keys at once (as has been seen before). Inspecting the structure of a request can often times reveal just as much as looking at the timings of the components.

There's a lot more that can be done with this data, but suffice it to say, analytics are only as powerful as their data source. A few people have written implementations of it:

Good monitoring is not only about the quantity of data collected, but also the quality.

December 6, 2010

Day 6 - Aggregating Monitoring Checks for Better Alerts

This article was written by Jordan Sissel (@jordansissel)

Chances are that your infrastructure has more than one machine performing the same role - frontend (webapps, etc), backend (databases, log collectors, etc), middleware (message brokers, proxies, etc), support services (config management, etc). Horizontal scaling means that you scale by adding more server resources, right?

Monitoring a horizontally scaled system can often lead to unintended noise. You might have 10 web servers, but 3 are broken, so you get 3 alerts. Maybe you monitor ssh health on all 50 of your servers, and someone pushed a bad config or there is a bad network connection, and now all 50 servers are alerting you about failures. Further, I believe that monitoring alerts (things that page you) should generally be business-oriented, not single-metric-and-single-server-oriented.

Even if you aren't running systems with duplicate roles, it often makes sense to collect multiple individual health checks into a single alert.

This calls for aggregating your data. Benefits of aggregation are increased alert value while decreasing alert noise. Noisy monitoring systems often result in yourself (and others) unconsciously training to ignore that system - don't let your monitoring servers cry, "Wolf!". Further, alerting on aggregates means you can do cool things like only alerting if, for example, more than 5% of things are failing - assuming that's safe for your business.

If you could keep the existing checks you have, not alert on them, but add aggregate checks that cause alerting, you could maintain your current fine-grain monitoring while improving alerting in both noise level and business relevance! Sounds like win-win.

There are some solutions for this already, like check_multi. but I didn't want to run additional or duplicate checks. Why? Some checks may take a long time (like a complex Selenium test), or may be resource-intensive to run (like verifying a large backup), or may not scale if I have to run 200 of them to answer one aggregated health check.

So, I took a different approach. Nagios already records state in a file on disk, so we can parse that file and produce an aggregate check. Lucky for me, there are already tools that parse this format, so most of the work is done already (nagiosity, checkmk_livestatus, and ruby-nagios). I picked ruby-nagios, for no particular reason. It didn't require much hacking to add what I needed. The result is nagios-manage and a tool: check_check.rb (comes with the nagios-manage rubygem).

Notes: Currently, this tool assumes a few things about what I want:

  • Skips checks that have notifications disabled
  • Skips checks that are marked in downtime
  • Only uses the hard state. If it is in soft critical, for example, it will assume the previous hard state.

The above constraints let me aggregate other nagios-state data into health that is deemed important - if one server is down for maintenance or has a known failure, I don't want to alert about it.

Examples:

# Summarize all checks for all hosts:
% check_check.rb
OK=110 WARNING=0 CRITICAL=0 UNKNOWN=0 services=// hosts=// 

# Summarize solr checks, when one check is failing:
% check_check.rb -s solrserver
OK=27 WARNING=0 CRITICAL=1 UNKNOWN=0 services=/solrserver/ hosts=// 
Services in CRITICAL:
  frontend1.example.com => solrserver client tests

The result in nagios looks something like this:

nagios check_check

By the way, the no-argument invocation is super useful for, from the command line, checking the overall health of everything nagios monitors.

For the solrserver check above, I would create one single check that would run the above check_check.rb command and alert appropriately. This saves me from having 28 potentially-failing-and-alerting checks. Further, if I get an alert about 1 critical check, I still have the further fine-grained alerting per server, so I can easily drill into what is failing.

Summarizing: I still have monitoring doing fine-grained, individual checks, like cpu usage, network activity, server behaviors, etc, but individual checks do not cause alerts themselves. This means setting the contacts for your individual checks to something that won't alert you. Instead, I use check_check.rb to aggregate results to reduce noise and to collect relevant data - alerting only on important failures in a way that doesn't flood the pager and helps me better indicate business-service problems to those on call.

December 18, 2009

Day 18 - Who Watches the Watcher?

The health of your infrastructure relies on you. You rely on a monitoring system (Nagios, etc) to detect problems and repair them or notify you of them, but what monitors the monitor?

Assuming for the moment that Nagios is your monitor. What happens when Nagios crashes or gets stuck? What happens if a syntax error creeps in and causes Nagios to fail at startup? It may be up, but not behaving correctly; how do you know? Moreover, if you have automated processes for generating and deploying Nagios configs and even upgrading Nagios, how do you know if things are working?

You need notification when your monitoring system is malfunctioning just like you want notification for any other important problem. It's possible you've overlooked this when configuring your monitoring systems, and solving this takes some thought, because not every solution is a complete one.

One option to consider is having Nagios check it's config file for problems on startup, and alerts you (via mail, whatever) on errors. This can be done with nagios -v <configfile>, which exits nonzero if there are config errors. Conveniently, if 'nagios' the command fails for another reason like the package was uninstalled, a dependent library is missing, etc, this also results in a nonzero exit code. This solution fails, however, to alert you when Nagios crashes or hangs.

Another option is to test behavior. One behavior to observe is the modification dates on Nagios' stored results, like status.dat (status_file in nagios.cfg) or the checkresults directory (check_result_path in nagios.cfg). If these items haven't been modified recently, it's possible Nagios is unhappy.

Both of the above solutions are incomplete because they run local to the monitoring host, and if that host fails, you don't get any notification. A solution is to run your monitor on at least two hosts and have them monitor each other. Your second monitor can just be a metamonitor (a monitor monitoring a monitor!) that does nothing else. Just remember that you should also monitor your metamonitor (meta-metamonitor?), and this can be done from your first Nagios instance.

How do we remotely monitor Nagios? The status.dat file is used as a data source when you access the Nagios web interface. The default web interface has a link "Process Info" which points to http://.../nagios/cgi-bin/extinfo.cgi?type=0. Included in the process info report is the last time an external command was run. Here's a test written in ruby that will remotely verify Nagios is healthy and the last check time is within some threshold. Example using this script :

# with nagios down (stopped safely)
% ruby nagios-last-update.rb localhost 900
extinfo.cgi returned bad data. Nagios is probably down?

# Recently started, no checks run yet:
% ruby nagios-last-update.rb localhost 900
last external command time is 'N/A'. Nagios may have just restarted.

# Working
% ruby nagios-last-update.rb localhost 900
OK. Nagios last-update 2.814607 seconds ago.

# Web server is up, but nagios isn't running:
% ruby nagios-last-update.rb localhost 900
Time of last Nagios check is older than 900.0 seconds: 1434.941687

# Web server is down
% ruby nagios-last-update.rb localhost 900
Connection refused when fetching http://localhost/nagios/cgi-bin/extinfo.cgi?type=0

# Host is unresponsive:
% ruby nagios-last-update.rb localhost 900     
Timeout (30) while fetching http://localhost/nagios/cgi-bin/extinfo.cgi?type=0
The script uses the proper exit statuses (0 == OK, 1 == warn, 2 == critical) nagios checks expect. There may be exceptions I'm not catching that I should, but uncaught ruby exceptions cause an exit code 1, which Nagios (or whatever) should interpret as a check failure.

Now we have a way to remotely verify the health of a Nagios instance that tells us if Nagios is running properly. Plug this into a monitoring instance on a different host, and you should get alerts whenever your Nagios instance is down.

Further reading:

December 17, 2009

Day 17 - Monitoring with Xymon

This article was written by Kent Brodie.

When you're a sysadmin of several systems, you soon find yourself needing a centralized `dashboard' (ugh, I hate that term!) of sorts for your systems. That is, a central monitoring point where, with one or two screens, you can easily check on the overall health of ALL of your systems. And yeah, it helps when the same monitoring tool/suite notifies you 24x7 when something goes awry.

In this context, many product names are familiar: Nagios, Zenoss, Hyperic, OpenNMS, but one that I personally feel that gets overlooked too often is Xymon.

Anyhow, all of the above-mentioned products work well. Some are free, and some are mostly free unless you wish to purchase support or perhaps value add-ons. After trying most of them out, I settled on Xymon. Why? Because it's simple, lightweight, flexible, scalable, and yes, free. The others? They're all quite good, but I found them time-consuming to set up, and many of the screens display "too much" for my liking. There can indeed be "too much" of a good thing.

Historical note: Xymon is the current name of the project formerly known as Hobbit. Due to a nastygram the project lead got from the Tolkien estate some time ago, the project had to be renamed. You will notice however that portions of the original project name are still there (configuration file names, for example). So long as you know that Hobbit=Xymon, you'll be fine.

If you've never seen Xymon, you need to check out the online demo. I guarantee it will take you about 60 seconds (or less) to see how it works. Go to http://www.xymon.com. You'll see a simple screen with a few catagories and colored icons: green = good, yellow = warning, red = bad. The Xymon "home screen" is quite simple, and is one of the reasons I like this setup so much. Simplicity = elegance.

Navigating the display is simple. Start with the icon next to "systems." You'll see a few servers listed and lots of status icons. Click on ANY of the status icons for info. Click on a CPU icon. Once you've done that, scroll to the bottom. Check out the RRD historical graph at the bottom. And click on it. Whoa - lots of history and trend info. By the way, the online demo is actual live Xymon monitoring of a few servers belonging to the project's primary author.

After playing with the demo, you will either say "feh", or you'll say "whoa-- this is pretty powerful, yet - simple". For the latter folks: read on.

Setting up Xymon is simple. It's available as RPMs and source. I prefer source. Compiling it (follow the instructions) is straightforward. By the way, your distro may still use 'hobbit' as the package name. I'm not going to go into how to build and install Xymon, my goal is to describe a few of the key configuration files that make Xymon work. Note, as you read on, the simplicity of the setup. Xymon includes easy hooks into your local apache server.

The primary file that drives Xymon is bb-hosts (Why bb? Hobbit.. er.. Xymon is an active branch of the older, less capable "Big Brother" monitoring package). The bb-hosts contains the systems you want to monitor. The first entry is the Xymon host itself (and is required). The other two shown in the example below are two additional servers I want to monitor. (see bb-hosts(5)).

The basic format of this file is pretty straightforward: IP and host name. Other options are available as extra tests per host, such as checking web pages, verifying oracle is running, and so on. You can add the options later as you become familiar with how it all works.

# format is
# ip-address       hostname                # tag1 tag2 ...
192.168.1.10       xyhost                  # bbd apache=http://127.0.0.1/
192.168.1.1        system1
192.168.1.2        system2

Once you get rolling, you can eventually categorize and group the Xymon display page to your liking. For example, you can have all of your web servers in one sub-page and all database servers in another sub-page. You can mix and match, and hosts can occupy multiple sub-pages if you wish. It's all a simple matter of editing bb-hosts and following examples in there.

The next file that will become of great importance to you is hobbit-alerts.cfg. This file describes the notification actions to take when an event occurs.

SERVICE=conn
 MAIL my.email@my.domain RECOVERED FORMAT=TEXT

The entry above says, "Whenever ANY server is unreachable via a simple ping, send a detailed message to the email address listed". There's lots of flexibility here. You can have alerts sent when only certain servers fail, and ignore alerts for others. You can limit the times of day that alerts are actually sent, and so on. It's important to not have your Xymon environment "cry wolf" with too many false or chatty alerts, or everyone will start ignoring them. SMS texting is also available using out-of-band methods.

That's it! After setting up a hobbit server and configuring only a handful of simple text files, you now have basic monitoring. Without anything installed on clients, hobbit can remotely monitor things like uptime (ping test), http, ftp, ssh, smtp, and a few others. The power comes in when you install a little hobbit client on each server. Then, you'll have it all: CPU, memory, disk, processes (and more). You also have the ability to download/customize or even write your own tests. There's a ton of available modules you can add.

I highly recommend getting started slowly. After you have basic Xymon monitoring as outlined above, go ahead and build the client and install it on ONE of your additional servers above. Make sure to allow the xymon port (the default is tcp 1984) into the xymon server. When you check out the Xymon display, you will notice the server that has the client running will report a lot more information available for you to investigate.

When I set up a new server (we add stuff weekly), one of my configuration steps is adding it to the hobbit/xymon monitoring. On the Xymon server side, I add one text entry in the bb-hosts file. On the client side (the new server), I create a hobbit user account, grab the client tarball that I built earlier, and untar it in the hobbit user's home directory. With the final step of adding an init script, I'm done. Takes about a minute. The client is VERY lightweight, and gathers data using simple available tools like "top", "df", etc.

I like Xymon because it meets the "Gene Simmons" principle. It's simple, and it's effective. All of your sysadmin tools should be that way.

Kent can be reached at kbrodie at wi.rr.com if you have any questions.

Further reading:

December 11, 2009

Day 11 - Looking for Trouble

This article was written by John Arundel.

Good sysadmins use automation and monitoring, but good sysadmins don't rely only on this. The problem with automated monitoring, as we know from the movie Jurassic Park, is that you only find what you're looking for. Where are those pesky raptors, anyway?

Jurassic Park: when monitoring isn't enough.

The other night I was looking at the process list on a server and saw there were several copies of the nightly backup script running. I found that the script was trying to upload the backup tarball to a remote NAS, and as part of this process, it tried to delete the previous week's tarball. This file didn't exist, so the command was failing, but the script wasn't smart enough to handle this, so it just kept retrying. As a result, the backup never got properly copied offsite, and the machine was starting to become overloaded with backup jobs.

Why is this important? Many monitoring systems would not pick up this condition. Would yours? You may want to improve your monitoring to detect at least the following:

  • Check that the job actually ran by looking at the modified date on the job's logfile.
  • Check that the job terminated (look for a completion message in its log) and check its exit status.
  • If the job creates a file, check for the existence and the size of this file.
  • If something gets copied offsite, check the offsite copy and make sure it exists and matches the source file.

You get the idea. No automated monitoring system is perfect. A great way to improve it is to look at your servers with an open mind, and when you find problems you didn't expect, add monitoring checks to catch them. Jordan's article on Cron Practices is a good place to start improving the reliability of your cron jobs.

I found several other little gotchas in the backup script which needed fixing. It's easy to assume that a script that's been in production for years is free of bugs. That's almost certainly not the case, and many of those bugs won't be found until you go through the script with a critical eye. If you use version control and test-driven development for your scripts, as recommended by Hugh Brown in his Development for Sysadmins article, this will be a big help.

A good sysadmin is a good detective. You should make time as part of your job to pick on a random machine every so often and examine it forensically, like a crime scene. What's here that shouldn't be? Are things working like they're supposed to? Are there any problems with this machine that have gone unnoticed by the automatic monitoring?

Here are some places to look:

  • Logwatch output (ideally, have this mailed to you and read it every day).
  • Root's mailbox: errors from cron jobs will come here, as will mail bounces.
  • The syslog is a great resource, but often very large and hard to read. Try configuring your syslog.conf to send messages from different subsystems (mail, for example) to different logfiles.
  • The process list (ps or top). What's running that you don't expect to see? Is anything using an unusual amount of CPU? Is the machine spending more time in iowait than it should (may indicate a disk problem or a degraded RAID array).
  • The crontab (not all jobs may run as root, so go looking in the /etc/cron.* directories and /var/spool/cron). What jobs are running? Are they working? Should they be there? Is their output logged and monitored?
  • netstat, iostat, and vmstat anomalies.
  • Places you (and I) wouldn't think of. Go snooping. See what catches your eye. A detective looks without preconceptions, so she's ready to spot the unexpected.

I hope the above makes you suspicious and paranoid, in a good way - a way that makes you a better sysadmin. Anything that can go wrong will go wrong, and is going wrong somewhere on your network, right now. If you get into the habit of looking for trouble, you're sure to find it! Finding trouble is better than trouble finding you.

Further reading:

December 20, 2008

Day 20 - Ganglia

Ganglia is a monitoring tool designed originally to help scalably monitor computing grids and clusters. How can it help you, even if you don't run traditional computing grids or clusters?

Ganglia is an RRDtool-based (like Cacti) monitoring and graphing system. Ganglia differs from Cacti in that configuration is much more automatic. Ganglia's design centers around two programs: gmond and gmetad. The gmond program listens for metric reports from other gmond programs (or tools that emit the same messages). The gmetad program periodically polls a single gmond for data on an entire cluster. The trick, here, is that every time gmond gets data, it sends that data via multicast to other gmonds, so every gmond has state for the whole cluster. I presume that the actual gmond used by gmetad is chosen at random, and if the chosen gmond host fails, another gmond host is chosen.

In addition to clusters (one gmetad for N gmonds), Ganglia supports a higher level collection they call a grid. A grid is automatically learned when you have one gmetad polling from another gmetad. I am unaware if you can have more than these levels (host, cluster, grid).

Multicast: This means your network gear will need multicast routing enabled if you hope to span broadcast domains with this monitoring. Alternately, gmond can be configured to send updates to a unicast address which can avoid needing multicast routing and other potentially difficult network features.

Both gmond and gmetad have reasonably easy-to-use configuration files and come with very reasonable default values. Simply running gmond and gmetad from the default configurations will result in data you can access easily. The primary Ganglia human interface is through a webserver.

Getting data out of Ganglia is easy. The historical data is stored in RRD files in a known location organized by cluster and hostname, so you can use your favorite rrdtool interface to query data. The current data is stored on any gmond which is queryable by connecting to ganglia's xml port (default 8649). The service listening on that port will dump the metric data by cluster and host in XML. XML might make you groan, but it's use will help you write tools (like nagios checks) to use the current data.

My first question after playing with Ganglia for a few minutes was, "How do I monitor my network gear?" Typical network gear won't allow you to run arbitrary binaries on them. Luckily, Ganglia comes with a tool for broadcasting metric messages, gmetric. With gmetric, you can spoof the source of a piece of data and easily claim that it came from your switch or router. This tool is also the easiest way to extend the metrics ganglia monitors for you. For example:

% gmetric -S "192.168.0.254:myrouter" -n uptime -v 3644 -t uint32 -u seconds
  spoofName: myrouter    spoofIP: 192.168.0.254 
And the metric reported on the xml port is:
<HOST NAME="myrouter" IP="192.168.0.254" REPORTED="1229761211" TN="28" TMAX="20" DMAX="0" LOCATION="unspecified" GMOND_STARTED="0">
<METRIC NAME="uptime" VAL="3644" TYPE="uint32" UNITS="seconds" TN="28" TMAX="60" DMAX="0" SLOPE="both" SOURCE="gmetric"/>
</HOST>
You can also specify the lifetime of the value, which will cause it to automatically be dropped from your gmond processes.

In addition to the gmetric command, there is are C and Python interfaces to gmetric. Additionally, if you want your own software to emit gmetric messages, there's an embedded gmetric library you can use.

My second question was, "What if a host is retired, is renamed, or is reconfigured?" If a host never again reports data about itself, the last state is still kept on every gmond and gmetad. To expire hosts that haven't spoken in a while, you should set the host_dmax value in gmond.conf to some value of seconds after which the host's state will be dropped. However, I am not sure the RRDs for this host will be cleaned up automatically. Host renaming probably requires that you rename the rrd directory holding the host's data if you wish to maintain historical data across the rename. If you reconfigure a host, deleting no-longer-used metric rrds is probably prudent. All of the above changes will likely require walking around in the ganglia rrd storage directory in your gmetad.

My last concern with ganglia was that the monitoring unit was a host. I think most often in services, not hosts. Thankfully, there are workarounds. Since you can spoof hostnames with gmetric, I decided to try something not-hostname-like to identify a service+host combo. I tried to spoof "service/hostname," but Ganglia uses this as the directory name and fails mkdir for not doing it recursively. Choosing another delimiter, comma, works fine:

Note: gmetric -S "foo/bar" will succeed, but gmetad will crash trying to write to that file path (mkdir not so smart). If you try this, you'll have to stop all gmond and gmetad instances then start them all again to clear the knowledge of the host named "foo/bar"

% gmetric -S "192.168.0.1:apache,aaa123" -n "apache errors" -v 5 -t uint32 -u "errors"
 spoofName: apache,aaa123    spoofIP: 192.168.0.1 
However, it appears that ganglia keys on IP as unique, so trying to add another entry of "192.168.0.1:mysql,aaa123" will appear in the web interface. Further testing revealed that the IP portion of the spoof is not validated. If we use the unique combination of "service,host" as both the IP and hostname, everything is peachy:
% gmetric -S "apache,aaa123:apache,aaa123" ...
% gmetric -S "mysql,aaa123:mysql,aaa123" ...
Pushing only apache-related data to the 'apache' host prefixes will help you organize your monitoring by service. This means you could easily view only apache data for a host, etc.

Ganglia makes me happy because I can worry only about giving it data. Adding a new data source only requires knowing how to get the data and feed it periodically to gmetric. After that, the data is automatically available in Ganglia's web interface. I fed (with gmetric) some fake data about mysql connections to see what happens, and this was the result.-

The wish-list of Ganglia features includes a talk of making it easy to provide custom graphs and views. Adding your own custom graphs requires, currently, hacking on the php code that presents the web interface. Glancing at the PHP powering the web interface doesn't make me cringe (easy to read!), so extending ganglia by adding your own views is probably reasonable.

Considering what I've found so far with Ganglia, the shortcomings mentioned here are easily worked around, and the potential benefits of less-painfully-configured data trending and monitoring seem quite good.

Oh, by the way, gmond works in Windows. The project has a cygwin binary that works by itself and can report data about a windows host. You can also use gmetric from windows hosts to report info about themselves.

Further reading:

December 13, 2008

Day 13 - Accessible Automation

Modern systems administration often involves saving yourself (and your company) time and money. If I had to list skills (of people) and features (of software) by priority, automation would be near the top.

This is usually why I get so mad at software that doesn't lend itself easily to automation. Day 6 pointed out some potential difficulty in automating Tripwire. I'm willing to forgive Tripwire since it's security software. I don't expect security guys to think about systems administration problems.

But what about something like Cacti? Cacti is a monitoring tool aimed at helping you track data and data trends on your systems. You can configure it to graph many things on many hosts; sounds like a systems administration tool, right? Monitoring sounds sysadmin-ey. Transitivity from sysadmin goes to automation. Therefore, I expect that Cacti will fall happily into my family of other automated configurations. If I have a few hundred machines in various, known configurations, can I easily put this data into Cacti and keep it up to date?

Cacti's main interface is a web interface, and such things do not easily lend themselves to automation.

Searching for 'cacti automation' will point you at Cacti's command-line scripts (add_device.php, for example). These scripts only support adding things, not modifying or deleting them. If you want to do that, you're almost on your own. Automation features started showing up in Cacti 0.8.6 from a feature request that there was no way to mass add devices. This request lead a few new functions and the scripts mentioned previously.

With that version and beyond, you can add devices, graphs, and other things, in an easily automated way. For all other interactions, you'll need to click your way through the web interface. Removing devices, etc... click click click. If you want to import or export graph, data, or host templates, you can do that using the web interface, but only one template at a time.

There is a file called "api_automation_tools.php" (or the other api_xxxx.php scripts) in Cacti that sounds promising, but has no documentation. Many of the functions are self documenting by name or simplicity, but others are in great need of documenting and simplicity. Reading over the code, it's not obvious to me how I can do automated maintenance of cacti's devices, graphs, etc. Looking at Cacti's roadmap, I don't see 'improvements in automation' on it. Plugins are on the roadmap, but it's unclear if plugins will help with automation. There is an existing plugin effort for Cacti, but none of the plugins appear to aid with automation.

My guess is that the reason that the available automation is poorly documented or doesn't exist is because of two reasons: first, that the developers didn't develop cacti with systems administrator priorities in mind, and second, that no one has made the feature request. The second point makes me wonder, is cacti only used by people with a handful of systems to monitor? As I research Cacti, it's starting to feel more and more like it isn't for people who want automation or is mainly for those who have plenty of time to click few zillion times keeping Cacti's information aligned with reality.

Automation should be accessible. It should be documented. If I can't find Cacti's automation documentation, if it exists, then it's not accessible automation. Yes, you could read the code and figure out exactly functions you needed to call to modify or remove a device, graph, or whatever. Or skip the code and look at the storage system to modify the configuration. Hacks produced with this method are troublesome and will not scale. You will be lucky if the hacks survive the upgrade to the next version. Further, reading the code so you can implement your own hacks is not accessible automation.

If an open source tool fits your needs but lacks automation, get involved in the community, if there is one. File bug reports and feature requests, or send patches if possible. If a commercial tool fits your needs but lacks automation, contact the vendor. Find out if they can implement what you need, and how long it might take. Don't get stuck with a tool that sucks away resources because the best maintenance interface is with the mouse and keyboard.

I'm not trying to pick on Cacti, specifically. Many software tools are simply not written with accessible automation or other important sysadmin features in mind. This is a very important feature to consider when looking for tools to solve a problem, because, as I've repeated previously, automation saves you time, effort, and errors.

Further reading:

December 4, 2008

Day 4 - Extending snmpd

Do you monitor your hosts with snmp? Ever wanted to add additional data sources to your snmp agent? Net-SNMP's snmpd lets you do this.

There are a few different options available to extend snmpd. The first is the most primitive, simply running a program and reporting the first line of output and the exit status. This is done with the 'exec' statement in snmpd.conf.

# Format is
# exec <name> <command> [args]
exec googleping /bin/ping -c 1 -w 1 -q
You need to specify the full path for 'exec' commands. If you want to run your command in /bin/sh, swap in 'sh' for 'exec' and you get to avoid the full path requirement. The 'exec' and 'sh' extensions command show results through the UCD-SNMP-MIB::extTable table:
% snmpwalk -v2c -c secret localhost UCD-SNMP-MIB::extTable
UCD-SNMP-MIB::extIndex.1 = INTEGER: 1
UCD-SNMP-MIB::extNames.1 = STRING: googleping
UCD-SNMP-MIB::extCommand.1 = STRING: /bin/ping
UCD-SNMP-MIB::extResult.1 = INTEGER: 0
UCD-SNMP-MIB::extOutput.1 = STRING: PING www.l.google.com (74.125.19.147) 56(84) bytes of data.
UCD-SNMP-MIB::extErrFix.1 = INTEGER: noError(0)
UCD-SNMP-MIB::extErrFixCmd.1 = STRING: 
You can see that the first line of output is available in extOutput. This is nice, but the order of commands depends entirely on the order in snmpd.conf, so if you put another 'exec' above the googleping one, the googleping check becomes .2 instead of .1, which is not so stable with respect to adding new exec statements or moving them around. Boo.

The second option available is called 'extend,' and it works similarly to 'exec,' but better. The 'extend' configuration accepts multiline output from your command and is indexed on the name (ie; "googleping") instead of an index number (ie; 1, 2, etc). Just change 'exec' to 'extend':

extend googleping /bin/ping -c 1 -w 1 -qn www.google.com
extend mysqlstatus /usr/bin/mysqladmin status
These 'extend' commands show up in NET-SNMP-AGENT-MIB::nsExtensions. If you only want the output, you can walk NET-SNMP-EXTEND-MIB::nsExtendOutput1Table (or nsExtendOutput2Table). If you want only the exit code, you can walk nsExtendResult. If you want to view the output of walking nsExtensions (it's too long to post here), click here.

Remember the benefit of 'extend' over 'exec' was that the indexing was on the name, so let's query for only the googleping result:

% snmpget -v2c -c secret localhost 'NET-SNMP-EXTEND-MIB::nsExtendResult."googleping"' 
NET-SNMP-EXTEND-MIB::nsExtendResult."googleping" = INTEGER: 0

# If I null route all www.google.com IPs, and requery:
% snmpget -v2c -c secret localhost 'NET-SNMP-EXTEND-MIB::nsExtendResult."googleping"' 
NET-SNMP-EXTEND-MIB::nsExtendResult."googleping" = INTEGER: 2
Take note above that the OID is in single quotes and "googleping" still needs to be sent as quoted to snmpget, this is so snmpget understands that this is really an octet-string OID. (See what "googleping" becomes with snmpget -On)

The output and exit code of your 'extend' and 'exec' statements are cached for a short period of time. The exact time saved in cache is determined by the nsExtendCacheTime OID. If you have write access configured in snmp, you can issue a SET command to change the cache time.

# Cache the googleping results for 15 seconds
% snmpset -v2c -c secret localhost 'NET-SNMP-EXTEND-MIB::nsExtendCacheTime."googleping"' i 15
NET-SNMP-EXTEND-MIB::nsExtendCacheTime."googleping" = INTEGER: 15

% snmpwalk -v2c -c secret localhost NET-SNMP-EXTEND-MIB::nsExtendCacheTime
NET-SNMP-EXTEND-MIB::nsExtendCacheTime."googleping" = INTEGER: 15
NET-SNMP-EXTEND-MIB::nsExtendCacheTime."mysqlstatus" = INTEGER: 5
Lastly, you can tell snmpd to 'pass' (that's the name of the config statement) handling of an entire OID subtree to an external program, which seems like a nice feature. This lets you write a subtree handler in your language of choice rather than being required (while still an option) to write your more complex handlers using snmpd's perl support or C module support. For brevity, I'll skip coverage of that, but it works similar to 'extend' and 'exec,' but has it's own (simple) text protocol for telling your subprocess what OID it wants data on (See further reading).

Extending SNMP to support your own data sources is a good way to allow your existing monitoring tools (nagios, etc) to monitor remotely without having to have local access such as with ssh or nrpe.

Further reading:

Net-SNMP snmpd extension configuration and documentation
See the "EXTENDING AGENT FUNCTIONALITY" section